
Display Glass for Handheld Devices
Link to Audiobooks
ADVANCED GLASS TECHNOLOGY
FOR HANDHELD AND INDUSTRIAL DEVICES
An Audiobook for Engineers and the Curious Mind
Reader Edition
Joseph McFadden
McFaddenCAE.com
July 2026
CONTENTS
CONTENTS.................................................................................. 2
ABOUT THIS SERIES.............................................................. 3
PREFACE...................................................................................... 4
CLOSING REMARKS.............................................................. 38
ABOUT THIS SERIES
This reader edition contains the complete text of the audiobook, which is published in four parts plus a short technical reference companion. For read-along listening, the chapters map to the audio as follows.
Part One, The Bench and the Players: Preface, Introduction, and Chapters One and Two.
Part Two, How Glass Breaks, and How We Make It Strong: Chapters Three through Six.
Part Three, The Slow Killer: Chapters Seven and Eight.
Part Four, The Market, the Trade-offs, and the Future: Chapters Nine through Twelve and the Conclusion.
Companion track: the Appendix of Technical Reference Tables.
Each audio part opens with a brief lead-in and closes with a preview of the next part; those bridges are not reproduced in this reader, which follows the master text.
PREFACE
Hello, my name is Joseph McFadden. I’m recording this from a basement office in Connecticut, just adjacent to the garage where I do my hands-on work. On the bench behind me, there is a piece of broken display glass sitting under a stereo microscope. I’ve been examining the fracture surface for the last hour — tracing the mirror, finding the mist boundary, reading the hackle pattern — working out exactly how this particular piece died.
That’s how I’d like to start this audiobook. Not with a tour of the technical literature, but with a piece of broken glass on a workbench, and the question of what it can teach us.
I’ve spent more than forty years as an engineer, an educator, and an investigator of failures. I’m offering this content to you not as a textbook, but as a conversation — a conversation with failure itself, with history, and with what I’ve personally seen happen when stress, environment, and microscopic flaws come together to break something that wasn’t supposed to break.
With this, I’d like to present an audiobook on advanced glass technology for handheld devices. But more than that, it’s about how I’ve come to understand these materials — on my own bench, with my own fixtures, using my own eyes — and how that understanding intersects with the published literature, the marketing claims, and the simulations that engineers run.
I generated this content through collaborative work with Grok, Gemini, Claude, and ChatGPT. The AI tools helped me organize and expand on the technical foundations. But the voice, the experimental grounding, and the interpretations are my own — drawn from years of cutting glass, bending glass, breaking glass, and reading the post-mortem evidence under magnification.
I trust you’ll find this educational, and I hope you’ll find it interesting.
ADVANCED GLASS TECHNOLOGY FOR HANDHELD AND INDUSTRIAL DEVICES —
An Audiobook for Engineers and the Curious Mind —
INTRODUCTION —
Welcome to a journey into the invisible — the thin sheet of glass that separates you from the digital world in your pocket. You touch it a hundred times a day. You’ve probably dropped it at least once. And yet, how much do you really know about this remarkable material that stands between your fingertips and a thousand-dollar repair bill?
I’m going to take you deep inside the world of advanced display glasses — not as a dry recitation of specifications, but as an exploration of physics, chemistry, engineering trade-offs, and the fierce technological competition that defines this multi-billion dollar industry. By the time we’re done, you’ll understand not just what these glasses do, but why they break, how engineers predict failure, and what the future holds.
This isn’t just about glass. It’s about fracture mechanics, about the statistical nature of failure, about the elegant dance between atoms during chemical strengthening, and about the slow, quiet, fluid-mediated crack growth that ages every screen in every pocket. It’s about understanding why that crack started at the corner, and why your phone survived a drop that killed your friend’s identical device.
Before we dive into theory, though, I’m going to spend a chapter telling you about my bench. Because every claim that follows in this book is filtered through what I’ve measured with my own hands, and I want you to know what kind of evidence I’m drawing on.
So settle in. We have a lot of ground to cover.
CHAPTER ONE: TOOLS OF THE TRADE —
The Bench. Before we dive into the physics, the chemistry, and the commercial landscape, I want to take a few minutes and tell you about how I actually study these materials. Because everything that follows in this audiobook is filtered through what I’ve learned with my own hands, on my own equipment, in my own garage and basement. If a particular claim sounds wrong to you later in the book, you should know what kind of evidence I’m drawing on to make it.
My laboratory is split between two spaces. The garage is where I do the physical work — cutting, bending, impacting, breaking. It’s where I keep the fixtures, the cutters, the sample stock, and the equipment that needs room and ventilation. The basement office is where I do the analysis — microscopy, photography, documentation, and the writing and recording of audiobooks like this one. The split is deliberate. Hands-on work and analytical work want different environments, and trying to do them in the same place compromises both.
A Holistic Approach. Before I describe my fixtures and processes, I want to be clear about what kind of work I’m doing — and what I’m not doing. I’m not running an industrial qualification lab. I’m not certifying parts against a customer specification, and I’m not generating data for a datasheet. My approach has always been to build fixtures that help me understand the nature of the material — to probe it, to poke it, to ask it questions through controlled loading and observation.
And critically, I factor in how I’m poking. Every test method shapes what you see. A four-point bend in a particular geometry reveals one population of flaws. A three-point bend reveals another. A ball-on-ring test reveals yet another. None of them is the true strength of the glass — they’re each different probes that excite different responses. So when I quote a number from my own bench, I’m telling you what my fixture measured under my conditions, with my approach. That’s not the same as a manufacturer’s specification, and it’s not meant to be.
This is what I mean by a holistic approach. I don’t rely on sterile datasheets whose generation I had no hand in. A number without first-hand experience of how it was measured is a number you can’t properly interpret. You don’t know what flaw population it sampled. You don’t know what loading geometry it assumed. You don’t know what environmental conditions it captured. You’re left guessing about all the things that actually determine whether the number applies to your problem.
By building my own fixtures and running my own tests, I get up close and personal with the material. I can listen to what the glass is telling me during the test — the small acoustic events that precede a fracture, the way deflection departs from linearity as a crack begins to move, the moment the load suddenly drops. Those signals don’t show up on a tabulated specification. They only show up if you’re there, watching, when the test happens.
And here’s the thing about being hands-on. You’re going to be wrong a lot. Your fixture won’t behave the way you expected. Your samples will fail in directions you didn’t anticipate. Your numbers won’t match the published values. That’s not failure of the method — that’s the method working. The gap between what you predicted and what actually happened is where the understanding lives. I’ll come back to this point.
Custom 3D-Printed Bend Fixtures. The single most useful investment I’ve made in this work is a set of custom three-D printed bend testing fixtures. Let me explain why three-D printing changed what I could do, and what those fixtures specifically reveal.
Commercial four-point bend fixtures are expensive, fixed in geometry, and designed for general-purpose materials testing. They don’t necessarily match the specific glass thicknesses, span requirements, or loading configurations that matter for display cover glass. With a three-D printer, I can iterate on fixture geometry in a day. If I want to change the support span, the loading span, the contact roller diameter, or the alignment features, I redesign and reprint overnight. That speed of iteration is what lets you actually probe the question you’re trying to answer, rather than fitting your question to whatever your equipment can do.
The fixtures I use are designed specifically for evaluating what I call medial cutting effects on glass. By that I mean the influence of edge quality — the median crack structure left behind by the scoring and breaking process — on the bending strength of the finished part. We’ll come back to medial cutting in detail in the next chapter, when we get into the physics of fracture.
Span-to-thickness ratio is everything in this kind of work. Too small a ratio and you get indentation effects under the loading rollers that contaminate the strength measurement. Too large and you’re measuring deflection compliance more than glass strength. For thin display glass in the half-millimeter range, a span-to-thickness ratio somewhere between thirty and fifty works well in my experience.
The Cutting Bench. The cutting bench is where some of my most interesting work happens — though if you’d judged my work by the quality of the cuts I was making, you’d probably have walked away unimpressed. Let me explain.
My cutting setup is built around a low-cost benchtop CNC that I modified for this work. The original machine was designed for light milling, not for glass scoring, but its programmable motion was exactly what I needed for repeatable, controlled cuts. The modification I’m proudest of is the force instrumentation I added to the cutting head — force gauges that let me measure the actual load the score wheel was applying to the glass surface in real time. With that combination, I could hold the speed and the path constant while I varied the load. Or vary the speed and hold the load. Or change the wheel and rerun the same conditions.
Did I get great cuts out of that system? Not really. The cuts had edge quality variability that would have been unacceptable in a production environment. But that wasn’t the point. The point was to learn — to learn how cutting load, cutting speed, and cutter condition each affect the resulting edge. And on that count, the system was an enormous success.
I learned that small changes in applied load produce disproportionately large changes in edge quality. I learned that cutting speed matters in non-obvious ways — too slow and the median crack has time to wander, too fast and you get bifurcations and incomplete penetration. I learned that wheel condition matters more than wheel sharpness — a perfectly sharp wheel with chipped facets gives worse edges than a slightly worn but uniformly profiled wheel. These are the kinds of patterns you can’t get from reading. You can only get them by varying one thing at a time and watching what happens.
And here’s the philosophical point I want to make, because it ties back to what I said about being hands-on. Learning comes from our predictive error. I’d predict what a change in load would do. I’d run the experiment. The result wouldn’t match my prediction — and that gap is where the learning lived. If you only run experiments where you already know the answer, you’re not learning anything. You’re confirming. The mistakes — the worse-than-expected cuts, the unexpected branching, the puzzling discontinuities — those are the teachers.
I tell my students this all the time. To understand the nature of things, we have to get our hands dirty. We have to expect errors and mistakes, and we have to recognize that those errors and mistakes are how we learn. Embrace it. Don’t shy away from the mundane work of grinding through experimental conditions. Don’t be embarrassed when the result surprises you — that surprise is the point.
After enough experimentation, I’d extracted most of the value the cutting setup could give me. And the honest truth is that cutting was never why I bought the machines. I’d ordered them off Amazon for their programmable motion, with an automated wipe system in mind for environmental cracking work — and then a set of glass cutting wheels and cutting oil pulled me down the scoring rabbit hole first. Not every experiment cooperated. The thicker display glasses cut beautifully, but the thin TFT glass was simply too small and too fragile for my rig, and it shattered. Those failures weren’t waste — they taught me exactly where my fixtures’ limits were. And the machines went on to their next lives, including the one I use most now: the clear PMMA containment enclosures that came with the CNCs became homemade environmental chambers — thermoelectric heating, ultrasonic humidification, Arduino control — in which I condition polymer samples under programmed temperature and humidity for stress relaxation and environmental cracking studies. I had planned to condition my glass samples the same way, but the supply went to other testing first, and that series is still waiting on fresh stock. You’ll hear me refer back to these chambers when we reach the slow killer in Chapter Seven. The lessons from the cutting work — about load, speed, and wheel condition — are the foundation for the ice-skater analogy I’ll share in the next chapter, which I think explains edge defect formation better than any textbook treatment I’ve encountered.
When you watch a cutting operation under magnification, you can actually see the median crack propagate ahead of the wheel — a vertical fracture extending downward into the glass thickness. The quality of that median crack determines the quality of the edge you’ll get after break-out. If the median is clean and continuous, your edge will be clean. If the median is interrupted, branched, or jagged, your edge will carry shark teeth and hackle.
Impact and Bending — Two Different Loading Modes. There’s an important clarification I need to make about how I think about loading, because I see this conflated all the time. When people hear “impact testing,” they often imagine the corner of a phone striking the ground and the edge of the cover glass shattering directly from that contact. That picture is wrong — and the engineering implications of getting it wrong are significant.
Impact on glass is fundamentally a surface load. When something strikes the face of the cover glass, the contact force is applied to the surface, and the local stresses are compressive directly beneath the contact, with tensile stresses ringing outward a short distance away. I do impact-test cover glass in my lab — with a custom drop apparatus that delivers a known mass from a known height onto a mounted sample — but the impact itself loads the surface. I do not impact the edge. You can’t usefully impact the edge of a thin display glass directly. The contact area is too small, the geometry is wrong, and that’s not how real devices fail anyway.
Edge failure in handheld devices comes from bending, not from edge impact. That’s the key insight, and once you internalize it, a lot of the field starts to make more sense. The bending can come from three distinct sources, all of which matter for understanding why these screens really fail.
First, full-device bend. When you sit on a phone in your back pocket, or grip the device hard at one end, or it gets pressed between heavy books in a backpack — the whole chassis flexes slightly. That flex puts the cover glass into bending, and the maximum tensile stress in that bending mode occurs at the edges. Edge flaws then become the failure origins.
Second, inertial loading during impact events. This is the subtle one. When the device decelerates against the ground during a drop, the perimeter of the cover glass is constrained by the frame — but the center of the display has mass. Display layers, adhesive, sometimes a touch sensor stack, all wanting to keep moving. That mass-distribution mismatch puts the cover glass into bending, with the center deflecting relative to the constrained perimeter. The impact event itself is brief, but the inertial bending it triggers is what reaches the edge flaws. So when a phone drops and the screen fails, the failure looks like it was caused by the impact — but the actual mechanism is the bending the impact provoked.
Third, internal push-out. Internal components can push outward against the cover glass from inside the device. Batteries that swell over time. Pressed-in connectors. Thermal expansion of the chassis. Even adhesive cure stresses. Once again, that’s a bending load. The cover glass acts as a constrained plate being pushed from beneath, and the tensile stresses concentrate at the perimeter.
So when I run bend tests in my fixtures, I’m directly probing the failure mode that matters most for real-world devices. When I run impact tests, I’m probing surface flaw populations and the dynamic strengthening behavior we’ll discuss in Chapter Six — but I don’t pretend my impact tests are replicating edge failure. Those are separate questions. Conflating them produces bad predictions and worse engineering decisions.
I’ve impact-tested chemically strengthened cover glass from multiple sources, with edges prepared in different ways, and the results have given me considerable respect for two things. First, how much edge quality matters — even though the impact loads the surface, the inertial bending it triggers makes edge flaws the dominant failure origins. The difference between a well-prepared edge and a poorly prepared edge can exceed fifty percent in impact survival. Second, how much variability there is even within ostensibly identical samples. Weibull statistics aren’t an academic abstraction. They’re the lived experience of anyone who tests glass.
Fractography Under the Microscope. The most important tool in my analytical kit isn’t expensive equipment — it’s a good stereo microscope and patient observation. Every broken piece of glass carries a chronological record of how it failed, written in the texture of the fracture surface.
I’ve taught myself to read these surfaces — to find the origin, to identify the mirror, to track the transition to mist and then to hackle, to spot Wallner lines and arrest marks. With practice, you can reconstruct the failure event from the surface alone: where it started, how fast it propagated, whether subcritical growth preceded the catastrophic event, what direction the loading came from, and roughly how much energy was released.
This is forensic engineering, and it’s an essential complement to the destructive testing. The bend test tells you when a sample broke. The fractography tells you why.
What This Has Taught Me That the Datasheets Don’t. After enough years on the bench, certain patterns emerge. Patterns that aren’t in the datasheets. Patterns that the marketing materials don’t mention. Let me share three of them up front, because they color everything that follows in this book.
First. Edge quality variability between manufacturers is much larger than the datasheets reveal. Two suppliers can claim the same compressive stress, the same depth of layer, the same composition — and produce parts with materially different real-world strength because their cutting and edge-finishing processes differ.
Second. Environmental conditioning matters more than people acknowledge. The same sample that breaks at one strength in dry conditions will break at substantially lower strength after a humidity soak. This isn’t a small effect. And the datasheets don’t tell you which manufacturers have tighter control over the surface chemistry that determines environmental susceptibility.
Third. Chemical strengthening at the edge is not the same as chemical strengthening at the surface. The cutting process leaves a damaged sub-surface region that the ion-exchange process can’t fully repair. Manufacturers that polish edges before chemical strengthening, or apply secondary edge processing, produce parts with measurably better long-term durability — but you won’t see this distinction broken out on any datasheet.
I bring these patterns into every chapter that follows. When I talk about edge vulnerability, I’m not just citing the literature — I’m reporting what I’ve measured. When I talk about environmental effects, I’m describing what I’ve seen happen to samples stored under different conditions. That’s the grounding for everything else.
CHAPTER TWO: THE GLASS ECOSYSTEM —
The Players at the Table. Let’s begin with the competitive landscape, because understanding who makes these materials and how they compete tells you a lot about where the technology is heading. The global market for display and cover glass is not a free-for-all. It’s an oligopoly — a small number of highly specialized manufacturers who compete not on price, but on innovation. Think of it as a technological arms race, where the currency is research and development, proprietary manufacturing secrets, and strategic partnerships with the device makers you actually recognize. At the top sits Corning Incorporated, the dominant player by a wide margin — recent market analyses put their share somewhere between fifty and seventy percent of the global cover glass market. You know their product even if you’ve never thought about it: Gorilla Glass. That name has become almost synonymous with smartphone durability. Corning maintains its dominance through a clever strategy of co-launching its newest, highest-performance materials exclusively with flagship devices from major manufacturers like Samsung. When Samsung announces a new Galaxy S phone, it’s often paired with a brand-new Gorilla Glass variant. This creates a virtuous cycle: premium devices get the best glass, which proves the technology, which drives demand. In second place is AGC Incorporated, formerly Asahi Glass, with a strong second-place position. Their Dragontrail brand competes directly with Gorilla Glass, and you’ll find it in devices from manufacturers like Huawei and Sony. AGC differentiates itself by emphasizing eco-friendly production — their glass is free of hazardous materials like lead, arsenic, and antimony — and the scalability of their float manufacturing process. Then there’s SCHOTT AG, the German specialist, with a premium niche position of roughly ten to fifteen percent. SCHOTT’s Xensation brand positions itself on superior break resistance, derived from pioneering work in lithium-aluminosilicate compositions. Where Corning focuses on drop performance on rough surfaces, SCHOTT focuses on achieving exceptionally deep compressive stress layers — a technical advantage we’ll explore in depth later. Nippon Electric Glass, or N-E-G, holds another segment of the market, primarily supplying Asian device makers with display substrates for Samsung and LG panels. And smaller players like CSG and Tunghsu fill out the remainder, focusing on budget and specialized segments. What strikes me about this market structure is that it’s not about making glass cheaper. It’s about making glass better. Every year, these companies pour millions into research, trying to solve what I call the Durability Trilemma — but we’ll get to that.
Two Categories of Glass: A Fundamental Distinction. Now, here’s something that might surprise you. Inside your phone, there are at least two completely different types of glass, serving completely different purposes. They’re not interchangeable. You cannot use one for the other’s job. Understanding this distinction is fundamental. The first type is the display substrate glass. You never see it. You never touch it. It’s buried inside the display assembly, serving as the foundation — the carrier for the thin-film transistors and color filters that actually create the image you see. These substrates are ultra-thin, typically between one-tenth of a millimeter and seven-tenths of a millimeter thick. And crucially, they are not chemically strengthened. Why not? Because the requirements for a substrate are completely different from the requirements for a protective cover. A substrate must survive high-temperature manufacturing processes — temperatures above six hundred degrees Celsius during semiconductor fabrication — without warping or shrinking. It must be alkali-free, meaning it contains no mobile sodium ions. Why? Because if sodium ions migrate into the delicate transistor layers, they catastrophically degrade electronic performance. And the substrate’s coefficient of thermal expansion must match silicon, because during processing, the glass and the transistors must expand and contract together. Corning’s EAGLE X-G and Lotus N-X-T, AGC’s AN Wizus, N-E-G’s O-A 31 — these are substrate glasses. Optimized for thermal stability and chemical purity. Not for drop resistance. The second type is the cover glass — the outermost protective layer. This is what you touch. This is what hits the ground when you fumble your phone. Cover glasses undergo chemical strengthening, a process that creates a high compressive stress on the surface. And their compositions are specifically designed to facilitate this process, containing the sodium ions that substrates must avoid. Using a cover glass as a substrate would be catastrophic — those sodium ions would poison the electronics. Using a fragile, non-strengthened substrate as a cover would result in immediate failure upon the first drop. Two glasses. Two purposes. Two completely separate supply chains, often served by the same parent companies.
The Evolution of Glass Compositions. Let me take you through the compositional evolution of cover glasses, because it’s a story of targeted problem-solving. Each new family of materials represents an engineering response to a specific limitation. We start with soda-lime glass, the most common and inexpensive type of glass, composed primarily of silica, soda, and lime. This is what windows are made of. It can be chemically strengthened to some degree, but its intrinsic mechanical properties are significantly inferior to more advanced compositions. Young’s modulus of about seventy-two gigapascals, Vickers hardness around four hundred fifty to five hundred, fracture toughness of about zero-point-seven to zero-point-seven-five megapascals-root-meter. It serves primarily as a baseline for comparison. Next came borosilicate glass, which incorporates boron trioxide into the silica matrix. The key advantage is a much lower coefficient of thermal expansion, giving superior resistance to thermal shock. You might recognize borosilicate as the material in laboratory glassware and certain cookware brands. Less common for cover glass, but important for understanding the compositional palette. The real innovation came with aluminosilicate glass. The inclusion of significant aluminum oxide, alumina, strengthens the glass network at the atomic level. The result is intrinsically higher stiffness, hardness, and bending strength. Young’s modulus jumps to around seventy-nine gigapascals. This robust composition forms the foundation for most chemically strengthened cover glasses, including the majority of Corning’s Gorilla Glass and AGC’s Dragontrail products. Then lithium-aluminosilicate, or LAS glass. Adding lithium oxide to the aluminosilicate base facilitates a more efficient and deeper ion-exchange process during chemical strengthening. SCHOTT pioneered this with its Xensation series. Young’s modulus increases to about eighty-two gigapascals, and the glass can achieve compressive stress layers greater than one hundred fifty micrometers deep. Lithium-alumino-borosilicate, or LABS glass, represents a further refinement. SCHOTT’s Xensation Alpha uniquely combines the high strengthening potential of LAS glass with the superior intrinsic scratch resistance characteristic of borosilicate glass. Up to one hundred percent improved drop performance on rough surfaces compared to conventional LAS glasses. And most recently, glass-ceramics — not purely amorphous glasses, but materials containing a controlled dispersion of nano-scale ceramic crystals within the amorphous matrix. Corning commercialized this with products like Gorilla Armor 2. The microstructure is specifically engineered to improve toughness by acting as a barrier to crack propagation. A crack that starts to grow in the glass matrix will be blunted or deflected when it encounters a crystal, dissipating energy and preventing catastrophic failure. This represents a fundamental shift in durability strategy. Instead of just compressing the surface to protect against flaws, you’re engineering the bulk material to actively manage fracture energy. It’s a different philosophy entirely.
CHAPTER THREE: THE PHYSICS OF BRITTLE FRACTURE —
Why Glass Breaks: The Fundamental Paradox. Now we come to what I consider the most fascinating part of this entire subject — the physics of why glass breaks. Because the answer is deeply counterintuitive, and understanding it changes how you think about these materials. Here’s the paradox. The theoretical strength of glass — based on the energy required to sever its interatomic silicon-oxygen bonds — is estimated to be as high as forty gigapascals. That’s an enormous number. And yet, the practical, measured strength of annealed glass is typically in the range of tens of megapascals. Do you see the discrepancy? We’re talking about orders of magnitude. The theoretical strength is about a thousand times higher than what we actually measure. So what’s going on? Where does all that potential strength disappear to? The answer is flaws. Microscopic imperfections. Cracks, scratches, chips, and defects that are inherent to any real glass surface. These flaws act as powerful stress concentrators, amplifying the local stress at the flaw tip to levels far exceeding the nominal applied stress. Think of it this way. Imagine you’re holding a piece of paper. If you try to tear it by pulling uniformly on both sides, it’s surprisingly difficult. But if you make a tiny nick with scissors at the edge, suddenly it tears easily. That nick concentrates the stress, creating a starting point for the tear to propagate. Glass works the same way, except the nicks are invisible, measured in micrometers, and they’re everywhere.
Griffith and the Birth of Fracture Mechanics. The foundational framework for understanding this phenomenon was established by A.A. Griffith in the nineteen-twenties. Griffith’s insight was elegant: a pre-existing crack will propagate only when the elastic strain energy released by its growth is sufficient to overcome the surface energy required to create the new fracture surfaces. It’s an energy balance. The crack wants to grow because doing so releases stored elastic energy. But growing the crack creates new surfaces, which costs energy. Propagation occurs when the energy released exceeds the energy cost. In modern fracture mechanics, this energy balance is characterized by the stress intensity factor, denoted K sub I, which describes the magnitude of the stress field at a crack tip under tensile loading. The subscript I refers to Mode One tensile opening, as opposed to shear modes. The equation is: K sub I equals Y times sigma times the square root of pi times a. Where Y is a geometry factor — about one-point-one-two for edge cracks — sigma is the applied stress, and lowercase a is the flaw size. Fracture is predicted to occur when K sub I reaches a critical material property known as the fracture toughness, K sub I C. For most aluminosilicate glasses used in handheld devices, K sub I C ranges from about zero-point-seven to zero-point-eighty-five megapascals-root-meter. This is remarkably low. For comparison, aluminum alloys have fracture toughness values around twenty-five to thirty-five. Steel can exceed one hundred. Glass is inherently fragile at the crack tip.
Phonon-Limited Crack Speeds: A Personal Observation. Here is something I rarely see discussed in the consumer literature, but which is absolutely central to understanding how glass breaks. Once a crack starts moving, it cannot accelerate forever. The crack tip is bound by the lattice itself, and specifically by the speed at which elastic waves — the phonons — can transmit information through the material. The theoretical ceiling on Mode One crack propagation is the Rayleigh surface wave speed. If you go looking in the formal literature, you’ll find the same physics described as elastic-wave-limited dynamic fracture — phonons and elastic waves are two vocabularies for one phenomenon, one atomistic, one continuum. Same ceiling, different bookshelf. But long before reaching that ceiling, the crack tip enters a regime of instability. In silicate glasses, measured crack-tip velocities top out somewhere between thirty and sixty percent of the Rayleigh wave speed — for typical compositions, the range is roughly fifteen hundred to thirty-five hundred meters per second. Why this ceiling? Because the energy delivered to the crack tip by the surrounding stress field cannot be dissipated faster than the phonons can carry it away. When you try to push the crack faster than the phonons can keep up, the energy has nowhere to go. So it does what energy always does. It finds another path. The crack bifurcates. It branches. It roughens. You can read this story directly on the fracture surface, in what fractographers call the mirror-mist-hackle sequence. The mirror region is the smooth, semi-circular zone immediately surrounding the origin — slow, sub-critical growth in the early phase. Then comes the mist region — a slightly hazy, granular texture as the crack accelerates and begins to interact with phonon-scale roughness. Finally, the hackle region, where the crack has reached its terminal velocity and is shedding energy into bifurcations and side branches. I’ve examined many broken display glasses on my own bench, and this signature is unmistakable. The size of the mirror tells you the initial stress intensity. The transition to mist tells you when the crack hit the phonon-controlled regime. The hackle tells you the crack ran out of room to dissipate energy by clean propagation, so it had to fracture chaotically. Every broken phone screen carries this chronological record. Once you know how to read it, you can reconstruct the failure event from the surface alone.
The Primacy of Tensile Stress. Here’s the key insight that follows from fracture mechanics: glass failure is overwhelmingly driven by tensile stresses. Tensile forces act to pull a flaw open, leading to crack propagation. Compressive forces tend to close flaws, inhibiting propagation. This is why glass exhibits a much higher compressive strength than tensile strength. You can squeeze glass quite hard without breaking it. But stretch it, bend it, subject one surface to tension — that’s where failure occurs. And this is exactly what happens in the bending modes we discussed in Chapter One. Full-device bend, inertial bending under impact, internal push-out — all of them put one surface of the cover glass into tension. The tensile surface is where cracks initiate. This principle — that failure is flaw-driven and tensile-stress-governed — is the single most important prerequisite for accurate analysis and simulation. It explains why chemical strengthening works: it places the surface flaws in a state of compression, forcing applied tensile stresses to first overcome that compression before the flaw tips experience any net tension. It explains the statistical nature of glass strength. And it dictates the selection of appropriate failure criteria in engineering simulations.
Surface Flaws Versus Edge Flaws: Not All Defects Are Equal. For a thin sheet of glass used in a handheld device, it is essential to recognize that the glass contains at least two distinct populations of flaws. Each population has its own characteristic severity, which defines two separate strength domains. Surface flaws are generally microscopic imperfections inherent to glass manufacturing and handling. During the float process, the glass surface contacts rollers. Subsequent handling introduces minor scratches and abrasions. These flaws are typically small — on the order of one to ten micrometers — and randomly distributed across the main surface, away from the edges. Edge flaws are something else entirely. They are macroscopic defects, far more severe than typical surface flaws. They’re introduced during the mechanical processes used to cut the glass sheet to its final shape — scoring and breaking. The cutting process creates a variety of sharp, stress-concentrating features that have evocative names. Shark teeth — sharp, V-shaped notches along the edge. Hackle — rough perpendicular fissures extending into the glass. V-chips — conchoidal fractures at the edge. Typical edge flaw sizes range from twenty to one hundred micrometers — up to ten times larger than surface flaws. And remember the stress intensity equation: K sub I is proportional to the square root of flaw size. A flaw that’s four times larger produces twice the stress intensity. A flaw that’s ten times larger produces more than three times the stress intensity. The presence of these severe edge flaws makes the edges the weakest link in the bending modes that dominate handheld failure. Research and experimental data are unequivocal on this point: poor edge quality can reduce the effective strength of the glass by fifty percent or more. Drop test analyses confirm this vulnerability — studies show that fifty-five to sixty percent of all crack initiations occur in the lower edge regions of the device. This has profound implications for simulation. A single, uniform failure criterion applied to an entire glass model is insufficient and will lead to inaccurate, non-conservative predictions. A robust methodology must treat the edges as a distinct region with a significantly lower failure threshold than the pristine surface.
The Ice Skater Analogy: Why Cutting Creates Shark Teeth. Now I want to share an analogy that I developed in my own laboratory, working with custom three-D printed bend testing fixtures and watching what happens during the glass cutting process. I call it the ice skater analogy. Picture a figure skater gliding across a sheet of ice. The blade is sharp, the contact is narrow, and the skater’s body weight is concentrated into a thin line of pressure on the ice surface. As long as the skater’s weight is steady, the blade traces a single, clean line. But the moment the skater’s weight fluctuates — a shift, a wobble, a change in posture — the blade behavior changes. The line widens, branches, or skips. Now think about what happens when a carbide wheel scores a piece of display glass. The wheel is the blade. The glass surface is the ice. And the applied load is the skater’s weight. When the cutting load is perfectly constant, the median crack propagates straight down beneath the wheel, creating a clean median vent. But the cutting load is never perfectly constant. There are micro-vibrations in the cutting head. There are surface inhomogeneities in the glass. There are micro-impurities, micro-densities, micro-residual-stresses. Every one of these causes the local stress intensity at the propagating crack tip to fluctuate. And just like the skater’s wobble, those fluctuations cause the crack to bifurcate — to branch sideways into the bulk material. That’s where shark teeth come from. That’s where hackle comes from. That’s where V-chips come from. Each one of those edge defects is the trace of a moment when the cutting load fluctuated, causing the propagating median crack to lose its single-path stability and split. This is why edge quality is so brutally sensitive to the cutting process. It’s not about how hard you press, or how sharp the wheel is. It’s about how steady the load is. A perfectly sharp wheel with a vibrating arm will produce worse edges than a slightly worn wheel with a rock-steady motion. Once you see the edge of a cut piece of glass under a microscope, and you understand that every shark tooth was a moment of crack bifurcation under fluctuating load, you start to think very differently about cutting equipment and process control. I’ve confirmed this in my own bench testing with the instrumented CNC: pieces cut with stable, well-controlled load profiles consistently outperform pieces cut under more variable conditions, even with identical wheels and identical glass. The skater needs steady weight. The cracker needs steady load.
The Median Crack and Medial Cutting Effects. The ice-skater analogy describes what happens at the surface during cutting. But the real story of cutting damage is below the surface. When a carbide wheel scores a piece of display glass, the visible scratch on the surface is only a small part of what actually happens. Beneath the wheel, a vertical fracture — what fractographers call the median crack — propagates downward into the glass thickness. The depth and quality of this median crack are what determine the cleanliness of the eventual edge once the part is broken out. This is the phenomenon I refer to as medial cutting — the formation of the median crack as the dominant feature controlling edge quality. There is a hierarchy of cracks created by a scoring operation. The median crack is the deepest and most important — the planar fracture that runs vertically beneath the score line, ideally extending nearly through the thickness when the part is broken. Lateral cracks fan out horizontally from the wheel contact zone, parallel to the surface, and they’re responsible for the chipping you sometimes see on the cut faces. Radial cracks emerge from the contact point at various angles. The interplay between these crack systems determines whether you get a clean break or a ragged one. The ideal scoring operation produces a single, continuous, perfectly planar median crack with minimal lateral cracking. In practice, that ideal is approached but never achieved. Real scoring produces a median that wanders slightly, sometimes branches, sometimes locally arrests and restarts. Each of those imperfections becomes a feature on the finished edge — the shark teeth, the hackle, the V-chips we just discussed. Understanding median crack behavior is critical for two reasons. First. It explains why some cutting processes produce dramatically better edges than others. The difference isn’t necessarily in the equipment — it can be in the load stability, the cutting speed, the wheel sharpness, the glass-wheel interaction chemistry. Anything that destabilizes the median crack as it propagates will show up as edge damage downstream. Second. It explains why edge polishing matters so much for high-performance applications. A polished edge removes the worst features of the imperfect median crack, leaving a much smaller distribution of remaining flaws. That isn’t cosmetic. That’s structural. This is why I designed my bend testing fixtures specifically to evaluate medial cutting effects. By bending strips of glass with different cutting histories — different wheel speeds, different break-out methods, different edge preparations — I can quantify how much each variable matters. The answer, consistently, is that cutting history is the single largest determinant of strength variability in finished cover glass parts. More than composition. More than thickness. More than chemical strengthening parameters within the normal range. The cutting determines everything that follows.
CHAPTER FOUR: THE STATISTICAL NATURE OF FAILURE —
Understanding the Weibull Distribution. The strength of a glass component is not a single, deterministic value. Due to the random size, orientation, and spatial distribution of flaws, strength is inherently probabilistic. You can’t say this glass will break at exactly five hundred megapascals. You can only say at five hundred megapascals, there’s a certain probability of failure. The standard statistical model used to describe this variability in brittle materials is the two-parameter Weibull distribution. Named after Swedish mathematician Waloddi Weibull, who developed it in the nineteen-thirties. The distribution is characterized by two key parameters. First, the characteristic strength, denoted sigma sub zero. This represents the stress at which there is a sixty-three-point-two percent probability of failure. It’s the scale parameter of the distribution. Second, the Weibull modulus, denoted lowercase m. This is a dimensionless shape parameter that quantifies the scatter or variability of the strength data. The cumulative distribution function is: Probability of failure equals one minus e to the power of negative sigma over sigma sub zero, all raised to the power of m. What does the Weibull modulus tell you? A low value, say two to five, indicates high variability and low reliability. The strength data is widely scattered, meaning failures can occur at stresses far below the average. This is common in untreated or poorly processed brittle materials. A moderate value, five to twenty, is typical for glasses like those in handheld devices. As-cut glass edges often have a lower modulus than polished surfaces because the machining process introduces a wider range of flaw severities. A high value, greater than twenty, indicates low variability, with failures clustering tightly around the characteristic strength. Advanced processing can increase the modulus. I see this every time I run a Weibull plot from my own bend tests. Two batches of nominally identical glass — same supplier, same nominal specifications — can yield very different moduli when one batch had better edge processing than the other. The mean strength may move only a little. But the lower tail of the distribution moves dramatically. And the lower tail is where field failures live.
The Danger of Using Mean Strength. Here’s a critically important point for anyone involved in design or simulation. Technical datasheets often report a Modulus of Rupture, or mean strength, which typically corresponds to a fifty percent probability of failure. Half the samples fail below this stress, half fail above. Using this mean value as a failure criterion in a simulation would be dangerously non-conservative. Why? Because the low Weibull modulus guarantees that a significant portion of samples in a production batch will fail at much lower stresses. With a modulus of five, about ten percent of samples fail below forty-five percent of the characteristic strength. That’s a huge gap between the mean and the lower tail. Engineering standards often specify design stresses at a probability of breakage of zero-point-eight percent or less. The metric you should care about is the B-ten value — the strength at which only ten percent of samples are expected to fail, representing ninety percent reliability. The B-ten calculation is: B-ten equals sigma sub zero times the quantity negative natural log of zero-point-nine, raised to the power of one over m. For a Weibull modulus of five, B-ten is about forty-five percent of the characteristic strength. For a modulus of twenty, B-ten is about eighty percent. The higher the modulus, the tighter the clustering, and the closer B-ten gets to the mean. When Corning reports that their AutoGrade Gorilla Glass has a B-ten greater than nine hundred megapascals after abrasion, they’re making a statement about reliability, not average performance. They’re saying that ninety percent of samples survive at least that stress level.
CHAPTER FIVE: THE SCIENCE OF CHEMICAL STRENGTHENING
The Ion-Exchange Process: A Dance of Atoms. Now we arrive at one of the most elegant engineering processes in materials science — chemical strengthening through ion exchange. This is what transforms ordinary aluminosilicate glass into the remarkably durable cover glass on your phone. The process is conceptually simple, even beautiful. But its effects are profound. Here’s what happens. The shaped glass part — already cut and polished to final dimensions — is submerged in a bath of molten potassium nitrate. The bath temperature is around four hundred degrees Celsius — hot enough that the ions in the glass network become mobile. At this temperature, a diffusion process begins. Smaller sodium ions near the glass surface — ions that are part of the original glass composition — diffuse out into the molten salt bath. Larger potassium ions from the bath diffuse in to take their place. Now here’s the key. When the glass is cooled back to room temperature, those larger potassium ions are effectively stuffed into sites that were originally sized for smaller sodium ions. It’s like forcing a large person into a small seat — there’s crowding, there’s strain. This crowding creates a powerful, permanent state of high-magnitude compression in the surface layer of the glass. Not mechanical compression from an external force — residual compression built into the material’s structure. And this compression is the magic. Because glass fails in tension, and because flaws are stress concentrators that require tensile stress to open and propagate, that pre-existing compressive stress acts as a damage shield. Any applied tensile force from a bend or an impact must first overcome the compressive stress before the flaw tips can experience any net tension.
C-S and D-O-L: The Two Critical Metrics. The protective layer created by ion exchange is characterized by two metrics that you’ll see on every datasheet. Compressive Stress, or C-S, is the magnitude of the compression at the very surface of the glass, measured in megapascals. For high-performance cover glasses, C-S values are consistently in the range of seven hundred to over one thousand megapascals. To put that in perspective, one thousand megapascals is about one hundred forty-five thousand pounds per square inch. That’s an enormous compressive stress, permanently built into the surface. Depth of Layer, or D-O-L, is the thickness of the compressive layer, measured from the surface inward to the point where the stress transitions from compression to tension. This depth is typically measured in micrometers. For most cover glasses, D-O-L ranges from forty to one hundred micrometers. Advanced LAS compositions and processing can achieve much deeper layers — SCHOTT’s Xensation products can exceed one hundred fifty to one hundred eighty micrometers. Think of C-S as the height of the damage shield, and D-O-L as its thickness. A glass with C-S of nine hundred megapascals can effectively withstand an applied tensile stress of eight hundred ninety-nine megapascals without any flaw experiencing net tension. And a deeper D-O-L means the shield extends further into the material, protecting against deeper flaws and more severe damage.
What Ion Exchange Does NOT Do. I need to make something very clear, because there’s a common misconception. The ion-exchange process does not increase the intrinsic tensile strength of the glass material itself. It does not increase the fracture toughness, K sub I C. The fundamental material properties remain the same. What it does is create a protective compressive stress layer. It’s purely a stress engineering solution — not a material enhancement. If you could somehow bypass that compressive layer — if you scratched deep enough to penetrate past the D-O-L and expose fresh glass in the tensile zone beneath — the exposed material would fail at the same low stresses as untreated glass. This is why both high C-S and deep D-O-L matter. High C-S provides a large stress budget. Deep D-O-L ensures that normal-depth damage doesn’t penetrate through the protective layer. And as we’ll see in the next two chapters, deep D-O-L pays a hidden dividend: it also protects against the slow, fluid-mediated cracking that ages every screen over time.
CHAPTER SIX: STATIC VERSUS DYNAMIC PERFORMANCE
The Time-Dependence of Glass Strength. Here’s something that might seem strange at first: the measured strength of glass depends on how fast you load it. The same glass, with the same flaws, will fail at a higher stress if you load it quickly than if you load it slowly. This isn’t measurement error. It’s physics. And it has profound implications for drop tests and simulation. The phenomenon is called subcritical crack growth, or stress corrosion. At slow loading rates — strain rates below about ten-to-the-minus-three per second — a crack has sufficient time to grow before the stress intensity reaches the critical fracture toughness. How? Water molecules at the crack tip facilitate the rupture of silicon-oxygen bonds. Even when the stress intensity K sub I is below the critical K sub I C, the crack can slowly extend. It’s a chemical process accelerated by stress — hence stress corrosion. This leads to delayed failure. Glass can break under sustained load at stresses that would have been survivable under rapid loading. And in humid environments, this effect reduces effective strength by twenty to fifty percent compared to inert, dry conditions. The subcritical crack growth velocity follows a power law: v equals d-a d-t equals A times K sub I to the power of n. Where lowercase n is the stress corrosion exponent — typically fifteen to twenty for these glasses at fifty percent relative humidity — and uppercase A is a coefficient that depends on environment. I want to flag this concept because it deserves its own dedicated treatment, which is what we’ll do in the very next chapter.
Dynamic Strengthening: The High-Rate Advantage. Now consider what happens at high strain rates — the rates characteristic of a drop impact. A drop from a height of one to two meters results in an impact velocity of about four to six meters per second. The strain rates during impact peak at ten-squared to ten-to-the-fourth per second, over contact times of about zero-point-one to one millisecond. At these high rates, the load is applied too quickly for subcritical crack growth to occur. There simply isn’t enough time for the stress corrosion process to extend the crack before the peak stress passes. This is called dynamic strengthening, and it increases the failure strain and stress by twenty to fifty percent compared to quasi-static values. Think about what this means for simulation. If you test glass slowly in the lab and measure a certain failure stress, then use that value to predict drop performance, you’ll be conservative but potentially overly conservative. The glass is actually stronger under impact than your slow test suggests. Conversely, if you test under impact conditions and use those higher values for a slow-loading application, you’ll be non-conservative and potentially unsafe. Understanding and correctly accounting for strain-rate effects is essential for accurate failure prediction.
Temperature Effects. Within the typical operational range of a handheld device — minus twenty to plus fifty degrees Celsius — temperature also has a measurable influence on strength. At minus twenty degrees Celsius, the glass becomes more brittle. Its ability to resist fracture decreases. Failure strain and strength can drop by ten to twenty percent. A device is statistically more likely to break when dropped on a cold day. At plus fifty degrees Celsius, minor viscoelastic effects can come into play, slightly increasing the material’s ability to dissipate energy. This can lead to a small increase in failure strain and strength of five to ten percent. Thermal shock — rapid temperature changes exceeding fifty to one hundred degrees Celsius across the glass pane — can also cause fracture, starting at edges where flaws are most severe. And here’s a caution about all of these figures: they are glass-level numbers, and the glass does not go through winter alone. Over the same temperature range, the assembly around the glass often changes more than the glass does. Cold stiffens the polymers, gaskets, and adhesives that would otherwise cushion an impact, so more of the blow is transmitted into the glass. Cold saps the battery, changes your grip, and puts frost on the surface. Heat softens the optically clear adhesive toward creep, raises internal battery pressure, and ages coatings faster. So when a device breaks on a cold day, the embrittlement of the glass is only one term in the equation — the stiffer, less forgiving structure around it is another, and sometimes the larger one. Treat temperature as a system variable, not a material property.
The Glass Lives in a System. Before we leave this chapter, I want to widen the lens, because everything I’ve just said about rate and temperature has a second layer that is easy to miss. This book is about the glass. But the glass never meets the world alone. It is bonded into a housing — adhesives, gaskets, a bezel, a frame — and apart from a direct impact to its face, essentially every load the glass ever feels arrives through that system. The pocket bends the chassis, and the chassis loads the glass. The drop strikes a corner, and the frame and the adhesive decide how much of that energy reaches the glass, how fast, and where. Think of it this way: the datasheet describes the glass the way a genome describes an organism. What actually breaks, or survives, is the phenotype — the glass as expressed in a particular housing, held by particular adhesives, living in particular environments — including environments we may not fully understand, but which are shaping the loading all the same. The mounting is where this gets concrete. The adhesives and gaskets that hold the glass in place are polymers, and polymers change stiffness dramatically with temperature and with loading rate. Cold makes them stiffer. Heat makes them softer. And because they are viscoelastic, a fast event like a drop makes the same adhesive behave stiffer than a slow push does — so the identical mount is, mechanically, a different constraint in a drop than in a pocket. Now follow the consequences in both directions. When the constraints are stiff — a cold day, a fast impact, a hard-set adhesive — the mount transfers energy into the glass efficiently, and holds the glass firmly to the housing. Less of the blow is absorbed in the joint. More of it arrives in the glass, and it arrives concentrated at the hard points — the corners, the fastening features, the bonded edge. The glass deflects less, but what it receives, it receives sharply. And it can fail somewhere stranger than the impact point. Picture a cold-day drop, with the adhesive at its stiffest and the glass coupled hard to the housing. Out in its free span, the glass bends in a simple arc. But where the adhesive grips it, the glass is forced to follow the housing’s motion instead — and right at the edge of the bond line, where grip hands off to freedom, the curvature has to reverse. The simple arc becomes a complicated S-shape, and the bending stress spikes locally at that inflection — at the boundary where adhesive and glass meet. The fracture origin ends up at the edge of the glue line, nowhere near the impact site — a failure you will never predict from the glass properties alone, and one that makes perfect sense the moment you think holistically and consider the system, not just the glass. When the constraints are soft — a hot dashboard, a compliant gasket, a slow load — the joint absorbs and spreads more of the energy, which sounds like pure benefit. It is not. A soft mount allows more relative motion, and that lets the glass pull away from its protective housing — deflecting proud of the bezel, bending across its own span instead of being supported, its edges momentarily exposed beyond the very features that were designed to shield them — and then slapping back against the hard stops on the rebound. Let me make that concrete with a face-down drop on a warm day. The adhesive is soft. The housing perimeter strikes the ground first and stops — but the display module, with the glass bonded to it, is a suspended mass on a compliant mount, and inertia does not care that the housing has arrived. The stack keeps traveling. For a few milliseconds the glass advances past the bezel that was supposed to stand proud of it — the housing may even be rebounding upward while the glass is still moving down — and if the ground at that spot holds a small pebble, a grain of grit, any point of debris, the leading surface meets it face-first. The shatter that follows gets blamed on bad luck. It was really a soft constraint, a warm afternoon, and Newton’s first law. So softer is not automatically safer, and stiffer is not automatically worse. They are different load paths with different failure modes. Stiff constraints concentrate stress at the mounts. Soft constraints trade transmitted energy for exposure and bending. The practical rule I want you to carry is this: when you evaluate temperature effects, or loading rate, evaluate them for the entire load path — glass, adhesive, gasket, frame — because those conditions decide how much of an event’s energy arrives in the glass as tension, and where it lands, before the glass’s own properties ever enter the calculation. And temperature does one more thing that neither the glass nor its mount can escape: it accelerates the chemical reactions involved in environmental crack growth — the topic we’ll explore in detail next.
CHAPTER SEVEN: FLUID-MEDIATED STRESS CRACKING THE SLOW KILLER —
Introducing the Slow Killer. In the last chapter, I touched briefly on subcritical crack growth. Now I want to spend real time on this topic, because I believe it’s one of the most underappreciated failure mechanisms in handheld display glass. Engineers spend a lot of time worrying about drops — about the dramatic, instantaneous shatter. But there’s another killer that works quietly, over weeks and months, while your phone sits in your pocket or on your nightstand. I call it the slow killer. The established technical names are stress corrosion, static fatigue, subcritical crack growth, and Environmental Stress Cracking, or E-S-C. They all describe the same family of phenomena: cracks growing under loads that would otherwise be perfectly safe, made possible by the presence of fluids — most commonly water. In my own work, I use a term I coined for this family: Energy-Mediated Fluid Cracking, or E-M-F-C. I coined it in my earlier work on environmental cracking in polymers, where I develop the underlying why in much greater depth than I will here. The framework was built to travel between materials — and this book is where it comes to glass. Here, I’ll give you the why at working depth — enough to reason with, enough to predict with, without the full derivation. This is fluid-mediated stress cracking, it deserves its own dedicated chapter, and it changes how you should think about cover glass longevity entirely.
Three Questions That Unify the Field. Over the years — and not just in glass, because environmental cracking is an old story in polymers too — I’ve come to teach this whole family of phenomena through three questions. Where is energy stored? What pathway allows that energy to create new surface? And how does a fluid change the cost, or the rate, of that pathway? Ask those three questions of any material and any fluid, and you have a framework that travels. In a polymer, the fluid may diffuse in, plasticize the matrix, swell it, or promote crazing — changing the work required to create new surface. In silicate glass, the answer to the third question is chemical and specific: water reacting with strained silicon-oxygen bonds at an open crack tip. The material chemistry differs completely. The energy logic rhymes. And that energy logic is the why behind the name. Go back to Griffith, from Chapter Three. Fracture is an energy transaction: a crack advances only when the elastic energy released pays the cost of creating new surface. Every part of that transaction can be attacked from the energy side. Stored energy is the budget — applied load, residual stress, the locked-in energy of ion exchange. The crack pathway is the purchase. And the fluid is a discount on the price: the water reaction at a strained silicon-oxygen bond replaces expensive, brute-force bond rupture with a cheap, low-activation chemical route to the same new surface. The crack doesn’t grow because the load got bigger. It grows because the fluid made new surface affordable at a load that used to be safe. That is the entire phenomenon in one sentence, and it’s why I put energy first in the name. The three questions also carry a built-in sanity check that I want to make explicit, because it prevents a misreading of this entire chapter. Fluid, stress, access, and time must act together. Humidity alone does not mean an unloaded screen is quietly cracking in a drawer. Crack growth needs a driving force — a tensile field pulling a flaw open. No opening, no strained bond, no reaction, no growth. The slow killer needs all four ingredients, and removing any one of them stalls the process.
The Water-Silica Reaction. Let me walk you through the chemistry, because once you see it, you can’t unsee it. At a crack tip in glass, you have a highly strained silicon-oxygen bond — the bond is stretched, distorted, ready to break. Water molecules in the surrounding environment — even just atmospheric humidity — can diffuse into that crack tip. When a water molecule encounters the strained silicon-oxygen-silicon bridge, it reacts. The reaction is: one silicon-oxygen-silicon bridge plus one water molecule yields two silicon-hydroxyl groups. In equation form: silicon-oxygen-silicon plus H-two-O yields two silicon-O-H. What was once a continuous bridge of glass is now two separate hydroxyl-terminated surfaces. The crack has advanced by one bond length. Multiply this by billions of bonds, and you have crack growth. The remarkable thing is that this reaction can proceed at stress intensities well below the critical value. The applied stress alone isn’t enough to break the bond. But stress plus water — that’s enough. The water molecule lowers the activation energy. It’s a chemical assist, mediated by mechanical stress. This is why we call it stress corrosion, or fluid-mediated stress cracking. The phenomenon was first systematically studied by Charles and Hillig at General Electric in the late nineteen-fifties, and refined by Wiederhorn at the National Bureau of Standards through the nineteen-sixties and seventies. The framework they developed remains the foundation of the field today.
The Three Regions of Subcritical Crack Growth. Glass fracture scientists have characterized this process in detail, and the resulting velocity versus stress-intensity curve has three distinct regions. Region One, at low stress intensities, is reaction-rate-limited. The crack grows slowly, and the rate is governed by the chemical kinetics of the water-silica reaction. This is where the power law applies: v equals A times K sub I to the power of n, with n typically fifteen to twenty for silicate glasses in humid air. Region Two, at intermediate stress intensities, is transport-limited. The crack is moving fast enough that water molecules can’t diffuse to the crack tip quickly enough. The growth rate plateaus, becoming relatively insensitive to stress intensity. The crack is essentially waiting for water to arrive. Region Three, near the critical fracture toughness, is mechanically dominated. Water no longer matters. The crack grows so fast that the bonds break by pure mechanical force. This is the regime of dynamic fracture, where you get the speeds approaching the phonon-limited ceiling we discussed in Chapter Three. The reason this three-region structure matters is that real glass spends most of its life in Region One. A phone screen sitting under your finger, your sweat, your pocket lint — that’s Region One. Slow, quiet, invisible crack growth, happening below the radar. By the time a flaw reaches Region Three, you’re holding broken glass.
Edge Vulnerability Revisited. Now let’s connect this to what we learned about edges. Edges contain larger flaws — twenty to one hundred micrometers, sometimes more. Larger flaws produce higher stress intensities for the same applied stress. And higher stress intensities mean faster subcritical crack growth, because of the steep n-equals-fifteen-to-twenty power law. So edges are doubly vulnerable. First, they have bigger flaws to start with. Second, those flaws sit closer to the critical threshold, so any environmental enhancement pushes them over the edge faster. Add to this a third vulnerability that I’ve confirmed in my own bench testing: edges are physically exposed to the environment. They’re not buried under an oleophobic coating. They’re not sealed against moisture by the phone case. Edge flaws are the front line of fluid-mediated attack. In my laboratory work, I see edge failures dominate when I test glass that’s been stored in humid conditions versus controlled dry environments. The difference is striking. A piece of glass that survives bending in dry nitrogen will fail at significantly lower loads after sitting overnight at fifty percent relative humidity. The flaws don’t grow visibly. The glass looks identical under a microscope. But the strength is gone, and a four-point bend test reveals it instantly.
Specific Environments and Their Effects. Different fluids attack glass at different rates. Pure water at neutral pH is the baseline. But the world your phone lives in is not neutral. Sweat is mildly acidic, around pH four to six. It also contains chlorides, lactates, urea, and ammonia. Each of these can interact with the silica network, accelerating crack growth beyond what pure water would do. Cleaning agents are another culprit. Seventy percent isopropyl alcohol — the standard for screen cleaning since the pandemic — does more than just strip the oleophobic coating. It can also displace water at crack tips and modify the local chemistry, with effects that vary by composition. Some cleaning solutions contain quaternary ammonium compounds, surfactants, and pH-adjusting agents that can enhance environmental fracture. Detergents, hand sanitizers, sunscreen — each leaves residues that subtly alter the chemical environment at any exposed flaw. Sea spray and saline are particularly aggressive — sodium chloride solutions accelerate silica dissolution and can attack the chemically strengthened layer itself through ion-exchange reversal. Alkaline cleaners, anything above pH ten, are the worst. High pH dramatically accelerates silica dissolution, hydrolyzing the network directly. None of these effects is dramatic. None will cause your screen to shatter on the spot. But over months and years, they’re shifting the statistical distribution of strength downward. The B-ten value of a heavily-used phone is not the B-ten value of a brand-new phone, even with no visible damage.
Cyclic Loading and Environmental Fatigue. Now layer on cyclic loading. Every time you press your phone screen, every time you flex the frame slightly by gripping it tightly, every time the device experiences thermal expansion and contraction — you’re applying small, repeated stress cycles to the cover glass. Combined with environmental moisture, this is the regime of energy-mediated fluid cracking, E-M-F-C. It’s analogous to corrosion fatigue in metals. Each cycle by itself is well below the failure threshold. But each cycle, in the presence of water, advances the crack by some tiny increment. The classic Paris law for fatigue crack growth applies, but with the rate constant elevated by the environmental contribution. Over a million cycles — and remember, you touch your screen hundreds of times a day — those increments add up. This is why a phone can fail after a year of normal use from what looks like a minor drop. The minor drop didn’t break the glass. The minor drop, combined with a year of pre-existing subcritical crack growth, broke the glass. Forensically, this distinction matters. When I examine such failures, the fracture surface tells the truth. A clean impact failure shows a sharp, small mirror zone around the origin. A failure preceded by months of subcritical growth shows an enlarged, slow-growth mirror that may even show concentric arrest lines from temperature or humidity cycling. The fracture is read like a tree ring.
The Load Spectrum of Ordinary Handling. Before we go further, I want to make that cyclic loading picture concrete, because the phrase stress cycles can sound abstract until you inventory what a device actually experiences in a normal day. Engineers who design aircraft wings and bridge decks work from something called a load spectrum — a catalog of every kind of loading event the structure will see, how large each one is, and how often it occurs. Your phone deserves the same treatment. Start with the touches. Several hundred screen contacts a day is typical, and heavy users go well beyond that. Each individual tap applies a trivially small contact pressure — but the device flexes, microscopically, against the gripping hand with every press, and over a three or four year service life those contacts number in the hundreds of thousands. Let me immediately head off a misreading, though. The stress from a fingertip is far below anything that grows a structural crack — touches matter only insofar as they flex the chassis, and even then they sit at the very bottom of the spectrum. The glass does not get tired of being touched. The cycles that count are the larger ones that follow. Then there’s the grip itself. One-handed use puts a small torsional load on the chassis every time a thumb reaches across the screen. Then the pocket. The back-pocket sit-down is probably the largest routine bending event a phone experiences — the device pressed against a curved surface and loaded with body weight. Some people do this dozens of times a day. Add the purse or the bag, where the device is compressed against keys, chargers, and coins — and note that this one is different in kind, because hard contents don’t just load the glass. They abrade it. A key dragged across a cover glass under pressure isn’t growing an existing flaw. It’s manufacturing a new one. If the device is a working tool rather than a personal phone, add the docking cycles — snapped in and out of chargers, holsters, and vehicle mounts thousands of times over a service life, each one a repeatable load applied at a repeatable location, which is precisely the recipe for localized fatigue. And add one load from the inside: a swelling battery pushes outward on the display stack from behind — a slow, sustained preload the glass never gets a rest from. And finally, the thermal cycles. Charging warms a device by ten to fifteen degrees Celsius. Moving from a heated building into winter air, or from air conditioning onto a summer sidewalk, imposes swings several times larger. Because the layers of the laminate stack expand at different rates, every one of those swings is a mechanical loading event, delivered through the adhesive interfaces.
Now, I want to be straightforward with you about the evidence here. I have not instrumented anyone’s pocket, and I don’t know of published load spectra for handheld devices the way we have them for airframes. What I’ve just given you is an engineer’s estimate — informed by my own bench work on bending, and by the physics we’ve already covered. But the bookkeeping framework is exactly the one we established. Each event in that spectrum contributes a small stress cycle. Each cycle, in the presence of moisture, advances existing flaws by a Paris-law increment. And the abrasive events replenish the flaw population itself. That last distinction deserves an emphasis of its own. Cyclic loading grows the flaws you have. Abrasion gives you new ones. A device that lives loose in a bag with keys is running both processes at once. By the time a device is a year old, it is no longer a pristine material coupon. It is a history-bearing structure — and its next failure will be a product of that history. And that, honestly, is the physics behind two accessories that often get dismissed as merchandising. A case does real mechanical work. It stiffens the chassis against bending, it keeps the glass edges from bearing directly on hard surfaces, and it partially shelters the edge — the front line of fluid-mediated attack — from moisture and residue. A screen protector, meanwhile, does nothing to strengthen the glass beneath it. What it does is take the abrasion. It’s a sacrificial surface that keeps the cover glass flaw population as close to factory-pristine as possible — and given everything we’ve said about strength being controlled by the worst flaw, preserving a pristine surface is not a cosmetic service. It’s a structural one.
Devices in the Wild: Climate Extremes. Everything in this chapter so far has quietly assumed a device living somewhere temperate. But phones ride along to the tropics, to deserts, and into arctic winters — and the slow killer responds to climate in ways worth spelling out. The environment your device lives in is not background noise — it is part of the load. The physics never changes. What changes are the dials. Temperature sets the reaction rate. Humidity sets the water supply. And the local routine sets the flaw supply. Take hot and humid first — a Gulf Coast summer, Singapore, Mumbai in the monsoon. This is the slow killer’s favorite climate. The stress corrosion reaction at the crack tip is thermally activated, and within the relevant range its rate roughly doubles for every ten to fifteen degree Celsius rise. Combine that with relative humidity high enough to keep a molecular water film on every surface around the clock, and Region One crack growth runs faster than almost anywhere else on Earth. And I want to be precise about what I know here, and how I know it. I have not yet run a glass conditioning series in my environmental chambers — my glass sample stock went to the cutting and bending work, and that series is waiting on fresh specimens. What I can tell you comes from two places. The published stress-corrosion research, which is unambiguous about the direction: the crack-tip reaction is thermally activated and water-fed, and the measured growth curves shift to faster velocities as temperature and humidity rise together. And my own chamber work on polymers, where environmental cracking accelerates measurably when both dials go up — a different material, but the same energy-mediated logic. So I will state the direction with confidence, and decline to put a glass number on it until my own bench produces one. And there’s a subtler mechanism stacked on top: condensation. A device carried from air conditioning into saturated outdoor air is, briefly, a cold object in warm wet air — and water condenses onto it, exactly as it beads on a cold drink. That’s not a thin adsorbed film. That’s bulk liquid water, delivered repeatedly, straight into the exposed edge flaws. Several such transitions a day, every day, in sweat-chemistry country. If I wanted to design an accelerated aging protocol for fluid-mediated cracking, I would struggle to improve on a commuter’s phone in a tropical city. Cold and dry is the mirror image, and it’s a genuine trade. In a Connecticut January, or a high-plains winter, the chemistry nearly stalls. Cold slows the reaction, and dry air starves the crack tip of water. Subcritical growth crawls. Meanwhile, the rest of the assembly changes around the glass, exactly as we discussed in Chapter Six: polymers, gaskets, and adhesives stiffen and transmit impact loads they would have cushioned in July, batteries fade, and gloved hands drop devices more often than bare ones. Even the oleophobic coating participates: in extreme cold it stiffens and grows prone to micro-cracking, quietly opening easier water access for later. And don’t picture only northern winters — heavily air-conditioned server rooms and data centers are cold-dry environments too, running year-round. And recall from Chapter Six what cold does to the glass itself — at minus twenty degrees Celsius it is measurably more brittle, with failure strain down ten to twenty percent. So the cold-climate device ages slowly but breaks more easily on any given day. Slow chemistry — brittle glass. And the real danger in a cold climate isn’t the cold. It’s the transition. A cold-soaked phone carried into a heated room takes a thermal shock across the pane, with the tensile transient concentrated where the flaws are worst — at the edges. And at the same moment, warm indoor air condenses moisture onto the still-cold glass. Brief tensile stress plus liquid water, delivered together, several times a day, all winter long. The climate that protects the device while you’re outside attacks it every time you come in.
Devices in the Wild: The Tarmac and the Factory Floor. Then there are the working environments. I want to walk through two of them, because each concentrates nearly every attack vector in this book into a single setting. First, the airport ramp. In summer sun, an asphalt apron can reach sixty or seventy degrees Celsius — hot enough that a device left on a tug dashboard or a tarmac cart is thermally soaked well beyond its comfortable operating range. Remember that the cover glass is bonded into a laminate, and the layers of that laminate expand at different rates. Sustained heat pushes the optically clear adhesive toward the soft end of its working range, drives shear at every interface, and is a classic recipe for delamination bubbles and edge lift — the functional failure axis, arriving long before anything cracks. Meanwhile, the mechanical environment is exactly the one the glass makers fear most. The drop surfaces are concrete and asphalt — the rough, sharp-asperity surfaces the entire current generation of cover materials has been engineered against, and the reason the manufacturers test on eighty-grit sandpaper. And the air itself carries grit. Jet blast and prop wash lift hard particulate — silica, alumina, whatever the pavement sheds — and hard airborne particles are a flaw-manufacturing service, scoring fresh damage into any exposed surface. Sunlight itself joins the attack: the intense U-V exposure of an open apron degrades the oleophobic coating far faster than indoor life would. And underneath it all runs vibration — tugs, carts, ground power units, the aircraft themselves — hours of low-level cyclic loading that works micro-abrasion deeper and keeps edge flaws gently exercised. I’ve seen the results of this environment directly — not on consumer phones, but in failure investigations of ruggedized handheld mobile computers, smartphone-class devices built for exactly this work. Units that lived on the ramp came to me carrying the coating loss, the edge attack, and the fracture patterns that wet, hot, cold, sun, and drop write into hardware — damage their office-bound counterparts never develop. Add winter, and you get deicing operations — glycol-based fluids misting over everything on the ramp, another entry in the chemical exposure ledger. Second, the factory floor — and here I’m on more familiar ground, because a machine shop is a small factory, and my garage has taught me what a machining environment does to exposed surfaces. Four things dominate. The dust. Industrial environments carry abrasive particulate that is frequently harder than the glass — aluminum oxide, silicon carbide, hardened steel chips. That dust settles on the screen, gets trapped under a wiping thumb or a shop rag, and scores the surface under contact pressure. That is sharp-contact flaw generation, running continuously, all shift long. The fluids. Water-based machining coolants are deliberately formulated alkaline — typically pH nine or above, to protect the machine ways from corrosion. Think back to the environment ranking earlier in this chapter. Alkaline solutions are the single most aggressive chemistry for silica, hydrolyzing the network directly. A coolant mist settling on a phone parked beside a CNC machine is placing the worst fluid we discussed directly onto the surface — and the end-of-shift solvent wipe-down that removes it also strips the oleophobic coating. The vibration. Machinery shakes everything near it, and a device parked on or near running equipment collects months of low-amplitude cyclic loading — individually trivial, collectively exactly the Paris-law bookkeeping we covered, quietly exercising edge flaws that would have stayed dormant on a desk. Construction sites bundle the whole package — dust, impact, chemistry, and vibration in one habitat. And the touch problems. A screen dusted with fine conductive metal particles, operated through gloves, in coolant mist — that’s the functional failure axis running at full throttle. Ghost touches, dead zones, erratic response. On a factory floor, “the screen is broken” usually means the functional kind long before it means the structural kind. And the machine shop is only one industrial habitat. Food and pharmaceutical plants run daily washdown with hot water and aggressive disinfectants — chemistries chosen to destroy biology, and indifferent to coatings and adhesives. Hospitals disinfect shared devices dozens of times a day. Cold-storage warehouses cycle equipment between freezer aisles and loading docks, manufacturing condensation events by the dozen per shift — which is why purpose-built freezer devices ship with heated touch panels and condensation-resistant construction. I’ve investigated failures out of those freezer aisles as well — the condensation cycle is not hypothetical. Cold reliability, like everything else in this chapter, turns out to be a system property, not a glass property. This, incidentally, is what the ruggedized device market is actually selling. The ingress protection ratings — I-P sixty-seven, I-P sixty-eight — certify sealing against dust and water reaching the electronics. They say nothing whatsoever about the strength of the cover glass. A rugged phone earns its keep through thicker glass, deep chemical strengthening, recessed bezels that keep the glass off the impact surface, and elastomer overmolding at the corners — mechanical design choices, every one of which maps onto a failure mode we’ve already covered.
One practical implication for anyone who qualifies devices for these environments: single-condition testing understates reality. The field applies sequences — a humidity soak followed by a drop. Vibration followed by wet operation. Freezer cycling followed by condensation and a hard docking. Chemical exposure followed by abrasion, followed by impact. Each individual stress might pass in isolation while the sequence fails in the field, because the first exposure conditions the flaw population and the second one exploits it. If your qualification plan tests each stress alone, it is testing a device that does not exist. And qualify against the worst plausible environment the device will actually see — not the average office. The slow killer doesn’t read the marketing specification. It reads the actual temperature, humidity, chemistry, and mechanical abuse of the life the device really lives.
The unifying point across all of these environments is that nothing new happens in any of them. The tropics turn up the reaction rate. The winter turns up the brittleness and the thermal transients. The tarmac and the factory turn up the flaw supply and the chemical aggression. Same slow killer, same Paris-law bookkeeping, same two failure axes — just different settings on the dials. If you understand the mechanisms in this chapter, you can walk into any environment on Earth and predict how a device will age there. That is the power of understanding mechanisms instead of memorizing test results.
How Chemical Strengthening Mitigates Fluid-Mediated Cracking. Here’s where chemical strengthening pays a second dividend that’s not often discussed in the marketing materials. The compressive layer doesn’t just shield against drops. It also shields against environmental crack growth. As long as the local stress at a surface flaw remains compressive — that is, as long as the applied tensile stress hasn’t exceeded the residual compression — the crack tip isn’t being pulled open. Water molecules can sit there all day, but with no Mode One tensile loading at the crack tip, the stress corrosion reaction has nothing to work with. The strained silicon-oxygen bond doesn’t get strained. The chemistry stalls. This is one of the strongest arguments for deep D-O-L. A deeper compressive layer means more flaws are sitting in compression, more of the time, including under sustained sub-critical loads. SCHOTT’s emphasis on D-O-L greater than one hundred fifty micrometers isn’t just about drop performance. It’s about long-term environmental durability. Edges, however, remain a problem. Chemical strengthening on a cut edge is less effective than on a polished surface. The cut surfaces have irregular geometry, deeper damage, and incomplete ion exchange penetration where the wheel ran through. So edge flaws often sit just at the boundary of the compressive layer, or even beyond it — meaning they’re exposed to net tensile stresses under normal use, and therefore fully vulnerable to E-S-C. This is where I think the next decade of progress is going to come from: edge polishing, secondary chemical strengthening of edges, and engineered edge geometries that minimize the macroscopic flaw population from cutting.
Implications for Design, Cleaning, and Service Life. All of this has practical implications. First. Deeper D-O-L is increasingly important as we extend phone service lifetimes. A phone that’s expected to last five years instead of two needs more environmental fracture margin. Every extra micrometer of D-O-L is an extra micrometer of edge resilience against the slow killer. Second. Edge processing matters more than the datasheet typically reveals. Polished edges, edges with secondary chemical strengthening, edges with anti-corrosion coatings — these will increasingly differentiate premium devices, even if they don’t show up in marketing. Third. The oleophobic coating is more than cosmetic. Its hydrophobicity reduces the water film thickness at the surface, which reduces the supply of water molecules to surface flaws. When you strip that coating with alcohol, you’re not just losing the smooth feel — you’re losing a thin layer of environmental protection against fluid-mediated cracking. The user who aggressively cleans with seventy percent I-P-A every day is making a trade-off they don’t know they’re making. Fourth. User behavior matters. The person who lets sweat sit on the device, who stores it in damp environments, who never lets it dry out — that person is statistically more likely to experience a fracture event months down the line, even from a perfectly normal drop. The drop didn’t cause the failure. The drop revealed the failure that was already brewing.
A Personal Observation from the Bench. In my own laboratory, I’ve come to believe that environmental fracture is the single most underappreciated factor in real-world phone failures. The textbooks focus on the dramatic stuff — drops, impacts, the moment of shatter. But when I examine fracture surfaces post-mortem under the microscope — and after all these years my favorite instrument is a simple handheld scope, which practice lets me pull better fracture images from than the bench unit — I see the signatures of slow growth. The mirror region — that smooth, semi-circular zone around the origin — is often larger than you’d expect from a clean impact. A large mirror, by itself, tells me one thing with confidence: the stress at final failure was low, because mirror radius scales inversely with the square of the failure stress. It takes the combination — the enlarged mirror, arrest lines when they are present, the condition of the surface and edges, and the service history — to make the case for slow growth before the final event. No single feature carries that conclusion alone. But when the features agree, they tell a consistent story of a crack that grew slowly, under low stress intensity, before the final catastrophic event. The mist and hackle regions then show the transition into dynamic, phonon-limited fracture. This mirror-mist-hackle progression is a chronological story written in glass. And in most failures I see, the story starts long before the device hit the ground. This is why I’ve come to view chemical strengthening, surface coatings, and edge processing not as three separate problems but as one integrated defense system against the slow killer. Each layer covers a different attack vector. Drop the coating, you expose surface flaws to faster water access. Skip the edge polish, you give the slow killer a head start. Skimp on D-O-L, you let cyclic loads punch through into the tensile bulk. Engineering durability for a five-year service life requires treating all three as load-bearing components of the same system.
CHAPTER EIGHT: CRITICAL STRAIN THRESHOLDS FOR SIMULATION —
Why Maximum Principal Strain? For engineers using Finite Element Analysis to simulate drop tests, selecting the correct failure criterion is not a matter of preference — it’s a requirement for physical accuracy. Because glass fails catastrophically in tension with negligible plastic deformation, failure criteria developed for ductile materials — von Mises, Tresca — are fundamentally inappropriate. They would give you meaningless results. The physics of brittle fracture, governed by the opening of flaws under tensile load, dictates that the failure criterion must be based on the maximum tensile stress or strain component. Both Maximum Principal Stress and Maximum Principal Strain are physically sound choices. But a strong consensus across technical literature and simulation best practices favors Maximum Principal Strain for explicit dynamic analyses. The primary reason is numerical robustness. In simulations with complex contact, shock waves, and high stress gradients, calculated stress values can be highly sensitive to mesh size and quality. Strain, being a more direct measure of deformation, is inherently less sensitive to these numerical artifacts. It provides a more stable and reliable indicator of failure initiation. In Abaqus, you’d implement this using the Brittle Cracking model or a user-defined subroutine. The key field output to request is maximum principal logarithmic strain — variable L-E, Max. Principal.
Location-Dependent Thresholds. Here’s the critical implementation detail that many analysts miss: a one-size-fits-all threshold is dangerously inaccurate. You must partition your F-E-A model into at least two material regions — surface and edge — and assign distinct failure properties to each. For non-strengthened aluminosilicate or borosilicate glass: Surface failure threshold: zero-point-zero-zero-one to zero-point-zero-zero-two strain — that’s zero-point-one to zero-point-two percent. Edge failure threshold: zero-point-zero-zero-zero-five to zero-point-zero-zero-one strain — zero-point-zero-five to zero-point-one percent. The edge threshold is half the surface threshold, reflecting the presence of larger, more severe manufacturing flaws. For chemically strengthened aluminosilicate or LAS glass: Surface failure threshold: zero-point-zero-zero-three to zero-point-zero-zero-five strain — zero-point-three to zero-point-five percent. Edge failure threshold: zero-point-zero-zero-one to zero-point-zero-zero-three strain — zero-point-one to zero-point-three percent. These are quasi-static baseline values. For dynamic simulations of drop tests, scale upward by twenty to fifty percent to account for dynamic strengthening. For long-duration loading simulations — sustained bend, thermal cycling, or sustained pocket pressure — scale downward by twenty to fifty percent to account for fluid-mediated subcritical crack growth. Failure to use location-dependent thresholds — using only the higher surface value for the entire part — will almost certainly miss edge-initiated fractures, which are the most common and critical failure mode in real-world drops.
One more caution before you carry these numbers into a model. They are screening values — starting points, not universal constants. The threshold that is right for your product depends on the flaw population your manufacturing process actually creates, the edge finish, the stressed area and its statistics, the loading rate, and the environment the glass has lived in — every variable this book has spent chapters on. The honest workflow is to calibrate against your own test data on your own parts, and then simulate. Use my ranges to sanity-check an unfamiliar problem or to catch an order-of-magnitude error — not to certify a design. A threshold copied from an unrelated glass, an unrelated process, or an unrelated book — including this one — is a number you can’t properly interpret. And you already know how I feel about those.
CHAPTER NINE: THE COMMERCIAL BATTLEFIELD —
Corning’s Empire: Gorilla Glass. Let’s turn from theory to practice and examine what the major players are actually selling. Corning’s portfolio is the market benchmark. Their strategy is characterized by a cadence of new product introductions timed to major smartphone launches — particularly Samsung flagships. It’s a partnership that benefits both companies: Samsung gets exclusive access to cutting-edge glass, and Corning gets flagship visibility and validation. Gorilla Glass Victus 2, introduced in twenty-twenty-two, is an aluminosilicate glass engineered to improve drop performance on rough surfaces. In lab tests, it survived drops from up to one meter onto eighty-grit sandpaper — a surface designed to simulate concrete — and up to two meters on smoother surfaces. Properties: Young’s modulus seventy-nine gigapascals, fracture toughness zero-point-eight-two megapascals-root-meter. Gorilla Armor, introduced in twenty-twenty-four with the Samsung Galaxy S-twenty-four Ultra, features an advanced anti-reflective coating that reduces surface reflections by up to seventy-five percent. It also claims four times more scratch resistance than competitive aluminosilicate glasses. This marked Corning’s expansion beyond pure drop resistance into optical performance. Gorilla Armor 2, debuting in January twenty-twenty-five with the Samsung Galaxy S-twenty-five Ultra, is Corning’s first flagship cover material to incorporate a glass-ceramic composition. It builds on the anti-reflective properties of Gorilla Armor but provides a substantial improvement in toughness. In lab tests, it survived drops of up to two-point-two meters onto a concrete-replicating surface. This is a thirty percent improvement over Victus 2. And then there’s the Gorilla Glass Ceramic line — a distinct product family that began as a play for enhanced toughness in mid-tier devices and has moved rapidly upmarket. Gorilla Glass Ceramic 2 arrived in May twenty-twenty-five on the Samsung Galaxy S-twenty-five Edge. Gorilla Glass Ceramic 3 followed in March twenty-twenty-six, debuting on Motorola’s razr fold — and its claims are notable on two counts. In Corning’s lab tests, it survived drops from greater than two meters onto concrete-replicating surfaces. More interesting to me, it survived at least twenty repeated one-meter drops onto asphalt-simulating surfaces, where Corning reports that a competitive aluminosilicate glass typically failed on the first drop. Pay attention to that repeated-drop framing. The industry has started marketing fatigue life rather than single-event survival — which tells you the manufacturers have internalized the same thing this book keeps arguing: real-world durability is cumulative. The strategy is clear: glass-ceramics are the future, and Corning is investing across the entire product range.
The Apple Axis: Ceramic Shield. No survey of this battlefield is complete without Apple, whose Ceramic Shield — co-developed with Corning and introduced on the iPhone 12 in twenty-twenty — put a glass-ceramic on the front of the world’s highest-volume premium phone years before the rest of the market followed. Despite the name, it isn’t a ceramic. It’s glass with ceramic nanocrystals grown into the matrix — precisely the crystalline crack-arrest strategy we’ll return to in Chapter Twelve. The first generation made a deliberate trade: it was optimized for drop toughness, and users noticed it picked up fine scratches more readily than they expected — better impact survival, worse cosmetics. Ceramic Shield 2, introduced in September twenty-twenty-five with the iPhone 17 lineup, is Apple’s answer to that complaint. The claim is three times the scratch resistance of the original, attributed to a denser nanocrystal structure, revised ion-exchange processing for higher surface compression, and a more durable oleophobic coating. Independent hardness testing has been broadly supportive — visible marking appeared only at level seven on the Mohs scale, where conventional cover glasses typically mark at five or six. By early twenty-twenty-six, Apple had propagated the material across its entire phone lineup, down to the entry model. Read that two-generation trajectory against the trilemma we’ll dissect in the next chapter and it makes perfect sense. Generation one bought toughness at the price of scratch performance. Generation two clawed the scratch performance back through crystal engineering and coating durability. The trade-space didn’t disappear — the engineers just found a better corner of it.
AGC and the End of Dragontrail. AGC’s Dragontrail portfolio competed directly with Gorilla Glass for a decade and a half, with different strategic emphases. Where Corning led with cutting-edge performance, AGC emphasized balanced performance, manufacturing scalability, and environmental responsibility. Dragontrail Pro was the workhorse alkali-aluminosilicate glass, offering a balanced property set. It was marketed as having thirty percent better durability against corner drops — a specific failure mode that’s common when phones hit the ground at an angle. Dragontrail Star 2, introduced in twenty-twenty-four, was AGC’s premium offering. It was a lithium-aluminosilicate glass engineered specifically for superior impact protection, competing directly with high-end Gorilla Glass variants. Across the portfolio, Dragontrail aluminosilicate glass typically featured a Young’s modulus of seventy-four gigapascals, strengthened Vickers hardness around six hundred seventy-three kilograms-force per millimeter squared, compressive stress capability greater than six hundred megapascals, and depth of layer between thirty-five and forty-five micrometers. AGC also emphasized that its production processes were free of hazardous materials and employed the scalable float manufacturing method — arguments aimed at environmentally conscious O-E-Ms.
Why am I speaking about all of this in the past tense? Because in December twenty-twenty-five, AGC announced it is exiting the chemically strengthened specialty glass business entirely. Production of the Dragontrail series at the Takasago factory in Japan is scheduled to end in the third quarter of twenty-twenty-six. The company’s stated reasons were falling market prices and sluggish order growth, with no realistic path back to profitability. Sit with that for a moment, because I think it’s the most important commercial development in this chapter. A technically capable glass, made by one of the largest glass companies on Earth, is leaving the market — not because it failed as a material, but because chemically strengthened aluminosilicate became a commodity. The performance differentiation — and the pricing power that goes with it — moved to glass-ceramics and to deep-strengthened LAS and LABS compositions, and the price of standing still was the business itself. There’s an engineering lesson buried in the market story, too. Qualifying a material is not only about performance. It includes continuity of supply, second sources, and the cost of redesign when a material family simply disappears. Every device maker with Dragontrail on a bill of materials is running that exercise right now — and every engineer choosing a cover glass today should be asking the supply question alongside the performance question.
SCHOTT’s German Engineering: Xensation. SCHOTT leverages deep materials science expertise to compete at the high end. Their portfolio is built on advanced LAS and LABS compositions, with a strategic focus on maximizing break resistance and resistance to environmental fracture through deep D-O-L. Xensation Up is a highly reliable and versatile lithium-aluminosilicate glass, known for excellent processing characteristics and exceptional strengthening capability. Compressive stress greater than nine hundred megapascals. Depth of layer greater than one hundred fifty micrometers — that’s significantly deeper than most competitors, and that depth is what carries the protection deep enough to defeat the slow killer over the device’s service life. Young’s modulus eighty-two gigapascals. Xensation Alpha is an advanced lithium-alumino-borosilicate glass — the LABS composition I mentioned earlier. It uniquely combines the high strengthening potential of LAS with the superior scratch resistance of borosilicate. SCHOTT claims up to one hundred percent improved drop performance on rough surfaces compared to competing premium LAS glasses. It was adopted in devices like the iQOO 15 in late twenty-twenty-five. Young’s modulus eighty gigapascals. Xensation Core is SCHOTT’s newest and most advanced LABS composition, with a singular focus on maximizing break resistance. The claimed performance is remarkable: drops from double the height and a tenfold higher survival rate compared to conventional aluminosilicate cover glasses. Xensation Flex is specialized ultra-thin glass for foldable devices. It can achieve a bending radius of less than two millimeters — essential for the tight folds in devices like Samsung’s Galaxy Z Flip.
CHAPTER TEN: THE DURABILITY TRILEMMA —
Three Competing Goals. Throughout this discussion, I’ve alluded to trade-offs. Now let’s make them explicit, because understanding these trade-offs reveals a lot about where the industry is and where it’s going. Manufacturers are constantly navigating what I call the Durability Trilemma — three competing performance goals that are difficult to maximize simultaneously: Drop Resistance, or Toughness: The ability to survive impacts without catastrophic fracture. This requires a material that either resists crack initiation or, more importantly, resists crack propagation once a crack starts to grow. Scratch Resistance, or Hardness: The ability to resist abrasive damage from keys, sand, and other hard particles. This requires high surface hardness — but harder materials are often more brittle, making them more susceptible to catastrophic fracture. Optical Performance: Clarity, low reflection, and visual quality. This requires specific compositions and coatings, which may not optimize mechanical properties. And I would argue we should now consider adding a fourth axis: Environmental Durability, the long-term resistance to fluid-mediated cracking over the multi-year service life of a device. Here’s the fundamental tension. Increasing hardness typically involves tighter atomic bonding, which makes the material more resistant to scratching but also more resistant to the localized plastic deformation that can blunt crack tips and absorb fracture energy. Harder glasses scratch less but may shatter more easily. Glass-ceramics represent one solution. The crystalline phase can arrest crack propagation, improving toughness, while the remaining amorphous phase can provide optical clarity. But glass-ceramics may sacrifice some scratch resistance compared to ultra-hard amorphous glasses. Different manufacturers have made different strategic choices. Corning focuses on bulk fracture management through glass-ceramics, plus optical enhancements through anti-reflective coatings. Drop resistance and optical performance are their current priorities. SCHOTT focuses on deep strengthening layers, D-O-L greater than one hundred fifty micrometers, and high C-S greater than nine hundred megapascals. Their LABS composition also addresses scratch resistance. They’re trying to address all three axes simultaneously, and they’re the strongest on the environmental durability axis as a side benefit of deep D-O-L. AGC emphasizes balanced performance and manufacturing scalability. They may not lead on any single axis, but they offer a competitive package at potentially lower cost.
The Future Belongs to Those Who Solve the Trilemma. The manufacturer who can simultaneously maximize all three properties — or at least achieve acceptable performance on all three while excelling on one — will dominate the next generation. Glass-ceramics are one path. The nano-crystalline phases arrest cracks, potentially without sacrificing optical clarity or hardness. But manufacturing is complex and yields may be lower. Advanced coatings are another path. Anti-reflective, anti-fingerprint, scratch-resistant, and water-shedding coatings on top of already-excellent glass could provide the optical, tactile, and environmental protection that determines real-world service life. And of course, there’s always the possibility of entirely new compositions — materials we haven’t seen yet, emerging from the R-and-D labs of Corning, AGC, SCHOTT, and others.
CHAPTER ELEVEN: SURFACE INTEGRITY AND THE OLEOPHOBIC LAYER —
What You Actually Touch. When you run your finger across your phone screen, you’re not actually touching glass. You’re touching an oleophobic coating — an extremely thin layer, typically ten to one hundred nanometers, of a fluoropolymer-based material. This coating serves a critical function: it makes the screen feel smooth, repels fingerprint oils, and allows smudges to be easily wiped away. Without it, your screen would feel different — tackier, greasier, harder to clean. The scientific measure of coating performance is the contact angle of a liquid droplet on the surface. A high contact angle — generally greater than ninety to one hundred ten degrees for water — indicates excellent repellency. The liquid beads up instead of spreading out. And as we saw in Chapter Seven, that beading-up behavior also reduces the supply of water molecules to surface flaws below, providing a quiet second line of defense against fluid-mediated stress cracking.
Why Your Screen Feels Different After a Year. Here’s something many consumers notice but few understand: after months of use, the screen doesn’t feel as nice as it did when new. Fingerprints seem to cling more. The smooth glide is gone. This is coating degradation, not glass degradation. The oleophobic coating is susceptible to both mechanical abrasion from daily use and chemical degradation from cleaning agents. Common disinfectants — particularly wipes and solutions containing seventy to ninety percent isopropyl alcohol — are effective at dissolving and stripping away the thin fluoropolymer layer. After fifty to one hundred cleaning cycles, the coating’s effectiveness is significantly reduced. The symptoms: increased fingerprint accumulation, loss of smooth tactile feel, potentially some haze reducing optical clarity. And quietly, in the background, the loss of that hydrophobic surface means water can now sit longer on the glass — providing more time for fluid-mediated cracking to advance any small flaws that exist.
The Critical Distinction: Cosmetic Versus Structural. Here’s what many consumers and even some engineers don’t realize: the immediate degradation of the oleophobic coating has almost no direct effect on the structural integrity of the glass. The bulk physical properties of the aluminosilicate glass — Young’s modulus, density, hardness, optical transmittance — are completely unchanged by alcohol-based cleaning. The compressive stress layer from chemical strengthening is highly stable. It is not relaxed, reversed, or damaged by exposure to common chemicals at room temperature. The durability of the glass against drops is preserved — at least, in the short term. The only potential structural impact comes from harsh, abrasive cleaners or cloths, which can introduce new micro-scratches typically less than one micrometer deep. These new flaws could theoretically act as stress concentrators and slightly lower effective strength. But for routine, non-abrasive cleaning methods, this direct effect is minimal. So when a user complains that their screen feels bad and seems weaker, they’re experiencing coating failure, not glass failure — not yet, anyway. The longer-term concern, as I argued in Chapter Seven, is that loss of the hydrophobic layer accelerates fluid-mediated crack growth at any pre-existing flaws. The solution is not a structurally stronger glass — it’s a more chemically-resistant oleophobic coating, or user-friendly reapplication kits to restore surface properties. This disconnect between perceived and actual durability is important to understand. The user experience is dominated by the fragile coating. The structural integrity is provided by the robust chemically strengthened glass. They’re separate systems, solving separate problems — but they interact, slowly, through the slow killer.
The Full Composite Touch-Screen Stack: Function Versus Physical Durability. So far in this chapter, and really throughout this book, I’ve talked about the cover glass as if it stands alone. But that’s a simplification I should correct before we move on. What you actually touch is not a single sheet of glass. It’s a bonded laminate — a stack. On top is the chemically strengthened cover glass. Beneath it sits a transparent conductive layer, usually indium-tin-oxide, or I-T-O, which forms the touch sensor. That’s bonded down with an optically clear adhesive, the O-C-A, to the display stack underneath. Four or more layers, each made of a different material, each responding to its environment in its own way. And here’s the distinction I want to draw, because it parallels the cosmetic-versus-structural distinction I just made. The environment attacks this stack along two completely separate axes. One is physical durability — the strength of the glass, which is what most of this book is about. The other is functional performance — whether the touch screen actually senses your finger correctly. Those are different failures, with different mechanisms, and it would be easy to conflate them. On the physical side, there’s nothing new for me to add. Humidity, sweat, cleaning agents — they accelerate subcritical crack growth in the cover glass exactly as I described in Chapter Seven. And loss of the oleophobic coating lets water sit on the surface longer, giving the slow killer more time to work. Same story, same chemistry. On the functional side, though, the failures look entirely different — and let me be straight with you about where I stand on this ground. I have no formal training in capacitive sensing electronics. But you may have noticed by now that I have never stayed in my lane — I’ve read stacks of papers on projected capacitive systems, and a couple of genuinely excellent books — Tony Gray’s Projected Capacitive Touch chief among them. I won’t call myself an expert — in my experience, the people who announce that title are usually the ones to be careful around — but I know this territory well enough to walk you through exactly how the electrical function and the mechanical stack collide. A thin film of moisture on the surface changes the local dielectric constant, and the touch controller can read that as a phantom touch — a tap that nobody made. Salt residues left behind by dried sweat or cleaning solution can form weakly conductive paths across the surface, producing ghost touches or dead zones where the screen stops responding. And over longer exposures, moisture ingress at the perimeter can delaminate the O-C-A or corrode the I-T-O traces, particularly at the edges, where the laminate is most exposed. These are the failures a user actually notices first. The screen acts erratic, registers touches that didn’t happen, ignores touches that did — long before the glass itself is anywhere near breaking. As a forensic matter, it’s worth remembering that the words “the screen is broken” can mean two very different things. Now let me answer two questions I get asked often, because they go straight to the heart of how this stack ages. The first: does the human body, acting as a large capacitor, fatigue the glass over the millions of touches it sees in its life — is there such a thing as capacitive fatigue? The answer is no. Your body’s capacitance is precisely how the touch controller detects your finger in the first place — that’s the sensing mechanism, working exactly as it was designed to. It does not alter the ion-exchange layer, and it does not change the bulk dielectric properties of the glass. The only thing repeated contact does over the long term is the mechanical and chemical wear we already covered — micro-abrasion of the surface and degradation of the coating. The glass does not get tired of being touched. The second question is the one I find most interesting, and it’s a good deal more subtle. Chemical strengthening leaves the surface of the glass in a state of locked-in compression. So the natural question is — is that stored strain energy just waiting to be released? The short answer is no — not in the way that phrase suggests. Once the glass cools after the potassium-nitrate bath, the potassium-for-sodium concentration gradient is effectively frozen in place. At room temperature, ionic diffusion is negligible — the ions would need something on the order of four hundred degrees Celsius to move appreciably again. So the compressive layer is stable. It is not slowly relaxing, it is not creeping, and it is not counting down to some spontaneous release. It is in equilibrium. But — and this is the part worth understanding — the energy is genuinely stored. The surface compression has to be balanced by something, and that something is a region of central tension in the interior of the glass — the C-T. The two live in a permanent standoff. The compressed surface wants to expand, the tensioned core holds it back, and the whole system sits in a stable energy well. That stored energy is only released if you break the standoff — if a flaw, a deep scratch, or edge damage penetrates through the compressive layer and reaches that central tension zone. Then, and only then, does the locked-in energy convert into a driving force for fracture. And if the central tension was designed too high — if the glass is what we call frangible — that release isn’t a single clean crack. The glass dices itself into a shower of fragments, because all of that stored energy suddenly has to go somewhere. So the strain energy is not sitting there waiting to be released. It’s waiting to be provoked. Leave the compressive layer intact, and the glass will hold its protective compression for the entire life of the device. Breach it deeply enough, and you find out precisely how much energy was stored in there all along. That, in a single image, is why edge damage is so dangerous — and why everything in this book keeps circling back to protecting the surface and the edge.
CHAPTER TWELVE: THE FUTURE OF DISPLAY GLASS —
The Foldable Revolution. The increasing commercial success of foldable smartphones — devices like Samsung’s Galaxy Z Flip and Z Fold series — is accelerating research into durable, ultra-thin glass. Think about the mechanical challenge. You need a glass that can bend to a radius of less than two millimeters — roughly the thickness of a credit card — and do so hundreds of thousands of times without failure. That’s not bending like a spring. That’s bending like — well, like nothing glass has ever been asked to do. Materials like SCHOTT’s Xensation Flex are moving from niche to mainstream. The requirements are extreme: maintain optical clarity and scratch resistance while surviving those tight folds. And in the foldable context, fluid-mediated cracking is even more critical — the cyclic strain at the fold combined with environmental moisture is precisely the E-M-F-C regime we discussed. The fold radius will likely be limited as much by the slow killer as by the elastic bending limit. This isn’t an incremental improvement. It’s a fundamental reimagining of what glass can do.
The Glass-Ceramic Era. Corning’s introduction of glass-ceramic compositions in its flagship Gorilla Armor 2 and the broader Ceramic line signals a fundamental strategic pivot — one that I believe will reshape the entire industry. The release cadence since has borne this out: Ceramic 2 in mid twenty-twenty-five, Ceramic 3 in early twenty-twenty-six, and Apple carrying Ceramic Shield 2 across its entire phone lineup. In barely two years, glass-ceramics went from flagship experiment to the default premium cover material. By incorporating a crystalline phase to actively arrest crack propagation, glass-ceramics offer a path to step-change improvements in toughness that may not be achievable with purely amorphous glasses. You’re no longer just protecting the surface with compressive stress. You’re engineering the bulk material to actively fight fracture. This shift from surface strengthening to bulk fracture management will likely become the next major competitive battleground. How crystalline should the material be? What crystal phase works best? How do you maintain optical clarity with dispersed crystals? How do the crystals affect environmental crack growth — do they slow the slow killer too? These are the questions the materials scientists are racing to answer.
Manufacturing and Sustainability. As the industry matures, factors beyond pure performance are gaining importance. Sustainability arguments remain in play across the industry: in an era of E-S-G-conscious consumers and regulators, being able to claim a clean, environmentally responsible supply chain is a competitive advantage. Though AGC’s exit from the cover-glass business is a sober reminder that a clean process is not, by itself, a viable business. At the same time, the entire industry faces challenges related to the complex manufacturing of these advanced materials. Glass-ceramics require precise thermal processing to nucleate and grow the crystalline phase. LAS and LABS compositions require high-purity raw materials. Yields can be low for certain processes, and supply chain vulnerabilities exist for critical inputs — and, as the Dragontrail exit demonstrates, for entire material families. Future competition will increasingly involve not just product performance, but also manufacturing efficiency, yield optimization, and demonstrable commitment to sustainability.
Expansion Beyond Smartphones. The advanced glass technologies developed for smartphones are finding significant new applications in other industries. The automotive industry is perhaps the most prominent growth area. Modern vehicles are incorporating larger, curved, and interactive digital dashboards. Head-up displays, H-U-Ds, are becoming standard in premium vehicles, projecting information onto the windshield. All of these applications require glass solutions with high durability, complex shapes, and superior optical quality. The requirements overlap with, but aren’t identical to, smartphone requirements. Automotive glass must survive wider temperature ranges, exposure to U-V, and potentially decades of use. The decade-scale service life makes environmental durability and resistance to fluid-mediated cracking absolutely central — these are problems you cannot afford to discover after a million cars are on the road. But the material science expertise developed in the consumer electronics market translates directly. Aerospace and industrial applications represent additional growth vectors. Anywhere there’s a need for a durable, optically clear interface between humans and machines, advanced display glass has a role to play.
CONCLUSION: A SYNTHESIS —
Let me step back and synthesize what we’ve covered.
First: Glass failure is governed by flaw-driven fracture. The durability of glass is not a measure of its bulk strength but its resistance to the propagation of pre-existing flaws. This principle of brittle fracture mechanics is the central concept that unifies the entire field. If you remember nothing else, remember this: glass is only as strong as its weakest flaw.
Second: Edge quality is paramount — and edges fail in bending, not in impact. Manufacturing-induced flaws at the glass edge are the most significant weak points, reducing effective strength by fifty percent or more. The shark teeth, hackle, and V-chips born from the ice-skater-like instability of cutting under fluctuating load are the front-line vulnerability of every cover glass. And they fail not because the edge gets struck, but because device-level bending, inertial bending during impact, and internal push-out all put the edge into tension. The median crack created during scoring — medial cutting — determines everything that follows for edge quality. Device durability is therefore as much a function of cutting and edge-finishing quality as it is of advanced material composition.
Third: The slow killer is real. Fluid-mediated stress cracking — stress corrosion, subcritical crack growth, what I named energy-mediated fluid cracking — is the quiet, chronic failure mechanism that ages every cover glass in every pocket. It operates below the radar of any single drop test, but over months and years it shifts the entire strength distribution downward. Engineers who design for a five-year service life must design against E-S-C, not just against impact.
Fourth: Maximum principal strain is the gold standard for simulation. A strong industry consensus identifies maximum principal strain as the most robust, physically appropriate, and numerically stable criterion for predicting failure in dynamic drop test simulations. A successful simulation must use location-dependent thresholds — significantly lower values for the edges than the surface — and must scale appropriately for strain rate and environment.
Fifth: The Durability Trilemma defines competition. The development of new cover glasses is a constant negotiation between three competing performance goals — drop resistance, scratch resistance, and optical performance — with environmental durability emerging as a fourth axis. The product portfolios of Corning, AGC, and SCHOTT represent different strategic approaches to this multi-axis problem.
Sixth: User perception is tied to coatings, not structure. The user’s tactile and cosmetic experience is dominated by the fragile oleophobic coating. Its degradation from cleaning does not directly affect the underlying structural integrity of the chemically strengthened glass — although it does quietly accelerate environmental cracking by exposing flaws to longer-duration water contact. This distinction between perceived and actual durability is often misunderstood.
Seventh: Dynamic strengthening must be accounted for. Glass exhibits twenty to fifty percent higher strength under high strain rate loading compared to quasi-static conditions, due to suppression of subcritical crack growth. Simulations must account for this effect to be accurate.
Eighth: Phonon physics sets the ceiling. Crack propagation cannot exceed roughly thirty to sixty percent of the Rayleigh wave speed before phonon dissipation forces bifurcation. The mirror-mist-hackle signature on every broken screen is the chronological record of this physics.
A Final Thought. Glass is one of humanity’s oldest materials — we’ve been making it for thousands of years. And yet, the glass in your pocket represents the absolute cutting edge of materials science. It’s chemically engineered at the atomic level, strengthened through controlled ion diffusion, defended against the slow killer with deep compressive layers and hydrophobic coatings, and optimized through statistical analysis and computational simulation. When you pick up your phone, you’re holding the product of millennia of human ingenuity — from the first glassmakers in ancient Mesopotamia, through Griffith’s fracture mechanics in the nineteen-twenties, through Charles, Hillig, and Wiederhorn’s work on stress corrosion in the nineteen-fifties through seventies, to the R-and-D labs in Corning, New York and Mainz, Germany today — and to the bench laboratories of independent investigators like myself, working from garages and basement offices, breaking glass, reading fracture surfaces, and trying to understand what the datasheets don’t say. And the story isn’t over. Glass-ceramics, ultra-thin foldable glass, advanced coatings, environment-resistant edge processing — the next chapter is being written right now. Thank you for joining me on this journey into the invisible. May your screens never shatter — and may the slow killer never catch up with them.
CLOSING REMARKS
This concludes the audiobook Advanced Glass Technology for Handheld and Industrial Devices: A Technical Reference for Engineers and the Curious Mind.
Thank you for listening. I hope these reflections challenge you, guide you, and inspire you to think more holistically about the materials, the systems, and the people you serve. Please feel free to share this content.
If you have questions or would like to discuss this further, feel free to contact me, Joe McFadden. My email is:
mcfadden@snet.net.
Combating engineering mind blindness — one student at a time.
Engineer. Lifelong learner. Holistic analyst. And most important — fellow human.
My blog is at — McFaddenCAE.com.
Have a thoughtful and wonderful day.

The Poke
The Poke
Reader Edition · Companion essay to “Advanced Glass Technology for Handheld and Industrial Devices” · J.P. McFadden
Welcome. I’m Joseph McFadden. This is a companion piece to the main series a step to the side, and a step deeper. The main series is about glass how it breaks, how we make it strong, how it ages in a pocket. This essay is about the thing underneath all of that. It’s about what actually happens physically, mechanically, right down at the bonds when you poke a material and it answers.
I want to tell you up front where this came from, because it did not start with glass. It started with a worry, and it ended at a door I did not expect. So give me a few minutes at the beginning that will feel a long way from fracture mechanics. I promise you the road comes back. In fact, the whole point is that all the roads come back to the same place.
Part One. Why we poke.
Watch anyone meet something unfamiliar, and you’ll see the same ancient gesture. A child meets a new object and pushes it. A mechanic taps a casting and listens. A geologist strikes a rock. A materials engineer drops a device onto concrete, or pulls a specimen in a load frame until it complains. Before we measure anything, before we theorize we poke. And then we watch, and we listen, for the answer.
It’s worth asking why this is so deeply in our nature. Because the answer, it turns out, is the same answer that governs the poke itself.
This didn’t begin with materials for me. It began with a worry. Over the years, I kept noticing something a decline in our collective critical thinking. A fading of the habit of asking why. And being who I am, I could not leave the why of that alone. That question pulled me into neuroscience. Into the brain. Into the electron transport chains the machinery of how we actually run.
And there, I noticed something odd. The authors kept invoking energy the way we all do casually, confidently, as if we had long since settled what the essence of the thing was. But we haven’t. That nagged at me. It pulled me deeper into the mitochondria, and then into the physics of us. And the further down I went, the clearer it became: we can account for energy to staggering precision track it, convert it, balance the books to the last decimal while having no real answer for what it is.
We have mastered the bookkeeping of something we cannot define. I find that thrilling, rather than discouraging. It’s a good reminder to hold our certainties loosely. Which, circling right back to where I started, is exactly the muscle I worry we are losing.
So let me say plainly what took me those couple of years to arrive at. We are, in the most literal thermodynamic sense, dissipative systems. A living thing is a pocket of order that sustains itself by taking in high-quality energy, using it, and shedding low-quality energy heat to its surroundings. We do not persist in spite of the second law of thermodynamics. We persist by serving it sliding the universe toward disorder more efficiently than the bare matter we’re made of could manage alone. A candle flame, a hurricane, and a human being are cousins in this respect. Each is a structure that exists because it dissipates a flow of energy. And each would vanish the moment that flow stopped.
There’s a beautiful idea here, from Jeremy England’s work on dissipation-driven adaptation, building on Prigogine before him. Matter driven hard enough by an energy source tends to fall into arrangements that dissipate that source better. Order emerges not against the current, but because of it. And if that view is even partly right, then curiosity itself the drive to probe, to disturb, to learn how the world will respond is a phenotype of energy dissipation. We poke because we are the kind of structure that energy flow builds.
I won’t wander any further into that fog, because the rest of this is concrete. But I raise it deliberately, because it reframes the whole exercise. When we poke a piece of glass, we are one energy-processing system interrogating another. The material’s response the wave that races out, the heat that blooms, the crack that runs is that material managing an energy flow of its own. The poke is not us acting on a passive object. It is two dissipative systems, briefly, in conversation. And the language they speak is energy.
Part Two. The poke is a question.
Press a fingertip against any material, and you have asked it a question at a single point. Energy and momentum enter one small region. And yet the response almost never stays there. The atoms nearby don’t, as a rule, travel with the disturbance. Instead, they shove their neighbors who shove theirs and a disturbance propagates outward, even though no single atom crosses the room.
Picture a crowded hall, and one person is pushed. That person stumbles into the next, who leans into the next, and a wave of jostling crosses the room while every individual stays roughly where they began. A mechanical wave in matter behaves much the same way. What travels is not the stuff. It’s the state a change in pressure, density, displacement, stress, strain, temperature, or damage handed from neighbor to neighbor.
How fast, and how faithfully, that message travels depends on the material’s stiffness, its density, its internal architecture and, crucially, the timescale of the poke. But speed is only the beginning. As the message travels, it can spread, disperse, reflect, change form, and bleed its organized energy into disorganized molecular motion heat. The message that arrives at a distant point is rarely a faithful copy of the poke. The material edits it in transit. And learning to read those edits is most of what materials characterization actually is.
Part Three. Gases. Consensus by collision.
Let’s begin with the most dilute crowd, where molecules spend nearly all their time in free flight, meeting only in fleeting collisions. Poke a gas clap your hands, drive a piston and you crowd molecules into a smaller space. Their collision rate rises. That local pressure bump shoves the molecules just beyond it, and the compression travels outward as a longitudinal pressure wave particle motion running parallel to the direction of travel.
Because there’s no permanent structure to carry the news, it can travel no faster than the messengers themselves. This is why the speed of sound in air about three hundred forty-three meters per second at room temperature sits just below the average thermal speed of the molecules. Sound in a gas is a statistical consensus propagating through a randomized, three-dimensional Newton’s cradle always a step behind the gossip that carries it.
Two consequences follow and both echo all the way up to glass. First: a gas transmits only compression. Push molecules together, and they push back. But try to shear a gas slide one layer across another and nothing restoring happens, because nothing connects the layers. A gas has one communication channel. Second: the relay leaks. Every collision randomizes a little organized push into disordered heat. So the pulse fades and high frequencies, which demand many faithful relays per second, fade first. A gentle poke gives a soft, nearly linear wave. A violent one gives a different conversation entirely. The compressed regions travel faster than the rarefied ones, the front steepens, and a shock wave forms the message sharpened from a whisper into an abrupt announcement.
Part Four. Liquids. The crowded room.
Condense the crowd until molecules touch continuously, and you have a liquid. Now a push transmits not by flight and collision, but by direct contact a shove passed hand to hand through a packed room, rather than shouted across a field. The relay is far stiffer, and faster. Sound in water travels about fourteen hundred eighty meters per second roughly four times its speed in air because the medium resists compression through contact, not through the statistics of collisions.
But a liquid still holds its neighbors loosely. Shear it slowly, and the molecules simply rearrange and forget. The disturbance dissipates as viscosity, rather than propagating as a wave. But shear it fast enough faster than the molecules can rearrange and a liquid briefly answers like a solid, transmitting shear before it can relax. And here is a principle worth carrying with you: whether matter behaves as a liquid or a solid can depend on how quickly you ask. Give the molecules time, and they flow. Deny them time, and they answer as if caged. A liquid is a solid that forgets quickly. And a glass as we’re about to see is a liquid that forgets on a timescale longer than civilizations.
A liquid’s surface adds behaviors its bulk never shows. Because a liquid tolerates compression far better than tension, a compressive pulse reflecting from a free surface can return inverted as tension. Pull hard enough that way, and the liquid tears. Vapor cavities open where none existed. This is cavitation and it’s worth dwelling on, because a bubble is an internal surface that did not exist a moment earlier. Once born, it rewrites the local conversation scattering incoming waves, and, when it collapses near a solid wall, focusing energy into a needle-fine jet that can pit hardened steel. Even in a liquid, the creation of a surface can turn a smooth traveling message into a concentrated local attack. Remember that. It is the whole story of fracture rehearsed in water.
Part Five. Solids. Communication acquires a grammar.
Bond the crowd permanently, and everything changes. In a solid, every atom sits in a well built by its neighbors, tied to them by bonds that behave, for small displacements, like springs. A poke no longer pushes messengers around. It stretches the network and the network answers collectively. And because a solid resists both compression and shear, it possesses two body-wave channels at last. Longitudinal waves also called P-waves with atoms oscillating along the direction of travel. And transverse, or shear, waves the S-waves with atoms oscillating across it. The longitudinal wave is always the faster of the two. And in stiff solids, both are very fast roughly five to six thousand meters per second for the compressional wave in silicate glass, or in steel.
The existence of that shear channel is the dividing line. A gas, or an ordinary liquid, lacking a static shear stiffness, cannot carry a low-frequency shear wave at all. A solid can. And with it, the solid gains a second language.
And a real poke never launches just one clean wave. It sets off a whole family longitudinal, shear, bending, contact, and surface waves which then reflect from every boundary, return, and interfere into a rich history. The solid doesn’t merely register how hard it was struck. It registers the duration, the rise time, the frequency content, the direction, the contact area, and the location. Two pokes with identical peak force can deliver utterly different messages. Which is exactly why, in a device, loading rate and temperature must be judged for the whole load path never for a single part in isolation.
Part Six. Rayleigh’s wave. The surface carries its own message.
There’s a third messenger and it belongs to Lord Rayleigh John William Strutt who showed, in eighteen eighty-five, that a free surface supports a wave all its own. A Rayleigh wave rolls along the surface in an elliptical, rolling motion a hybrid of compression and shear its amplitude decaying with depth, so that most of its energy travels within about one wavelength of the surface. It moves a touch slower than the bulk shear wave typically around ninety percent of that speed. Earthquakes deliver much of their damage through Rayleigh waves for exactly this reason. The energy refuses to spread into the depth. It runs concentrated along the surface where everything we build sits.
Now hold that geometry. Because in a sheet of cover glass, everything we care about also lives at the surface. Scratches. Handling marks. Contact edges. And above all, the flaws left by cutting. All of them occupy the exact skin where Rayleigh energy concentrates. A blow that looks mild when averaged over the whole part can be severe in that near-surface zone. The material and the shape always speak together.
Part Seven. Phonons. The atomic language of vibration.
At engineering scale, we describe all this with smooth fields stress, strain, density, displacement, varying continuously through the body. At the atomic scale, the same communication has a different name. Displace one atom, and you change the forces on its neighbors. The disturbance spreads as a coordinated lattice vibration. And when you count those vibrations in their smallest allowed packets, you have phonons.
A phonon is to a lattice vibration what a photon is to light. The smallest unit of the wave. A quantum of collective vibrational energy, carrying a frequency and a direction. It is not a tiny bead rattling between atoms. It is an organized excitation that the whole lattice shares. Every mechanical message a solid sends itself sound, heat, the stress field racing ahead of a crack tip is written in phonons. And phonons interact with each other, with electrons, with defects, with grain boundaries, with free surfaces. Every interaction is another chance for the message to be redirected, attenuated, or converted into another form of energy. Every one is a road. And every road runs toward the same destination energy, redistributed.
Part Eight. Glass. A network with no address book.
Glass is the most revealing solid of all. Because it is rigid without being periodic. A silicate network frozen into permanent disorder a solid by every mechanical test, and a liquid by ancestry. Its bonds are as stiff as any crystal’s, so the speed of communication stays high. But the network has no repeating structure. And this transforms the fidelity of communication.
In a perfect crystal, a phonon is a citizen with a passport. The lattice periodicity guarantees it a clear direction and a long, ballistic path. In a glass, no periodicity guarantees anything. Long-wavelength vibrations, which average over the disorder, travel well which is why glass rings, and carries sound. But the short-wavelength, high-frequency vibrations meet a different fate. And here’s the consequence that deserves far more attention than it gets. The violent vibrational energy released when a bond snaps cannot cleanly leave. It scatters within nanometers, smeared into heat almost where it was born. This is why glass conducts heat so poorly. And at the crack tip, it means the tip runs hot, and stays hot vibrationally excited. The stress-corrosion reaction that ages every screen is a thermally activated process. So in glass, the messenger loiters at the scene and the loitering does chemistry.
The disorder also sets fracture’s speed limit. A crack is a disturbance that must continuously announce itself to the material ahead. The stress field at its tip is built and rebuilt by elastic waves. So a crack cannot outrun its own announcement. The ceiling is the Rayleigh speed fitting, since the crack is itself creating new free surface. But long before that ceiling, the channel saturates. Energy arrives at the tip faster than a single clean front can shed it. The front goes unstable. And the crack begins to roughen, and branch. In silicate glass, the terminal velocity lands near thirty to sixty percent of the Rayleigh speed. And the fracture surface keeps the minutes of the whole negotiation. The smooth mirror zone is where the channel still had headroom. The mist is the onset of congestion. And the coarse hackle is the channel overwhelmed the message fragmenting into every available sideband. To read mirror, mist, and hackle is to read a communication log. The record of how a material tried and finally failed to carry a message its own structure could not hold.
And glass never receives a poke as a blank slate. It carries the memory of its melting, its forming, its cutting, its handling, its ion exchange, and every prior load. The poke meets a history not a material.
Part Nine. Plastics. A message filtered through molecular time.
Polymers carry the liquid’s rate-dependence into permanent solidity. A plastic is a tangle of long chains stiff along each backbone, weakly coupled between chains, with segments that can rotate, straighten, slide, and disentangle on timescales running from microseconds to years. Poke it slowly, and the chains have time to slither and rearrange. Much of the message is absorbed, dissipated as internal friction. Poke it fast faster than the segments can respond and the tangle has no time to be clever. It answers stiffly, even glassily, and passes the pulse nearly intact. This is viscoelasticity. A plastic responds not only to how hard it’s poked but to how quickly and for how long.
And this is not a laboratory curiosity. It is the mechanical heart of every bonded display. The adhesive bead holding a cover glass is a communication component. On a warm day, under a slow push, it whispers absorbing the message before it reaches the glass. On a cold morning or in the tenth of a millisecond of a drop the same bead stiffens into a rigid conductor and delivers the blow verbatim. The identical joint is a different medium at different rates and temperatures. Which is exactly why the glass must be understood as living inside a system not standing alone.
And the environment enters here too. Moisture, oils, fuels, and cleaners can change molecular mobility, or lower the energetic cost of making new surface. In the language of energy-mediated fluid cracking, the fluid does not simply attack the polymer. It alters the conditions under which existing surfaces extend, and new ones form. The mechanical poke, the fluid, the morphology, and the stored stress all speak at once. And failure emerges from their conversation not from any one voice.
Part Ten. Metals. Communication with shock absorbers.
A metal crystal is the aristocrat of mechanical communication. Periodic order gives phonons long, ballistic paths. And a sea of free electrons adds a second, faster courier for energy. Which is why a metal feels cold to the touch, and glass does not the metal is conducting your hand’s heat away efficiently. Struck within its elastic limit, a metal transmits with crystalline fidelity.
But a real engineering metal is a crystal full of imperfections grains of differing orientation, grain boundaries, dislocations, inclusions, residual stresses. And each one edits the passing message. But then the capability no glass possesses. When the message grows too loud, a metal can reroute it into motion. Dislocations glide, letting planes of atoms slip past one another. So at a stress concentration where glass has no option but to pour all the arriving energy into a crack tip a metal spends that energy moving dislocations instead. The sharp tip blunts. The stress redistributes. The message is absorbed into permanent shape change rather than new surface. That single difference is worth two to three orders of magnitude in fracture toughness.
Glass is brittle not because its bonds are weak but because it is monolingual. It has only one language for stress and that language ends in a crack. Ductility is not the opposite of strength. It is the possession of a second language.
Part Eleven. Every surface changes the rules.
Everything so far quietly assumed a continuous medium. But real matter is full of interruptions. And every interruption is a place where the conditions change a boundary where the wave must split into reflected and transmitted parts, often converting between longitudinal and shear as it does. A wave meeting a boundary may reflect, and transmit. It may refract, bending as its speed changes. It may convert mode, changing language at the border. It may scatter, smearing a coherent pulse into a diffuse field. It may disperse. It may attenuate, its energy converted into heat, or plastic work, or crack growth. And it may focus so that a notch, a corner, a hole, or a crack receives a far stronger local message than the average response of the whole structure would ever predict.
And here is the crucial idea. These internal and external surfaces are the material’s memory. Grain boundaries record solidification. Residual stress records uneven deformation. Scratches record handling. A crack records an earlier moment when local energy exceeded local resistance. So when a fresh poke arrives, it interacts with that memory. And the response is path-dependent. Two parts of nominally identical material answer the same poke differently because their internal maps of surface and stored energy differ. This exactly this is why a datasheet number cannot fully predict a real part. The datasheet describes the medium in general. The poke interrogates this component with its geometry, its flaws, its constraints, its environment, and its history. It is the whole argument for treating a glass component as a phenotype rather than a specification. The datasheet is the genome. But what breaks, or survives, is the material as expressed in a particular body, with a particular past.
And there’s one more thing the external surface does the cruelest thing. It is simultaneously the guided channel and the flaw archive. Surfaces collect handling damage. And edges where two surfaces meet, and where cutting left its worst damage collect the most severe flaws of all. So wave mechanics routes the loudest, most persistent part of every disturbance straight through the one region where the largest stress concentrators already wait. The strongest message meets the weakest listener. That coincidence not bad luck is why most field failures are born at edges. And why edge quality buys more reliability, per unit effort, than any other single variable in the process.
Part Twelve. Turning the tables. Engineering the conversation.
If a disturbance is a message shaped by structure, then structure can be designed to shape the message on purpose. This is the leap from studying wave propagation to engineering it. And it has a name phononic crystals.
A phononic crystal is a material made periodic on purpose a repeating arrangement of contrasting stiffness or density built so that its internal interfaces interfere with waves in a controlled way. Just as a crystal’s atomic periodicity opens electronic band gaps, a phononic crystal opens phononic band gaps ranges of frequency in which mechanical waves simply cannot propagate. Inside a gap, a wave becomes evanescent, and dies away. The medium becomes, for those frequencies, deaf.
And the point, for a working engineer, is direct. Everything we described as something that happens to a material reflection, scattering, the trapping and channeling of energy can instead become something a material is built to do. A laminated windshield’s polymer interlayer, a rugged handheld’s foam gasket these are early, blunt instances of the same instinct. Deliberate internal surfaces, placed in the wave’s path, to edit the message before it reaches the glass. We began by learning to listen to what a material says when poked. Phononic crystals are where we start deciding what it is allowed to say.
Part Thirteen. What the system heard.
Come back, now, to the bench. A force transducer tells us what we applied. An accelerometer tells us what moved. A strain gauge tells us what deformed. A microphone, or an acoustic-emission sensor, tells us what waves escaped. A thermal camera shows where organized energy became heat. A crack shows where the local conversation went unstable. Not one of these is the whole truth. Each is a single listener, at a single place, tuned to a single part of the message.
The poke may begin as a simple exchange of momentum. But the answer divides among translation, rotation, vibration, stored elastic strain, viscoelastic loss, heat, plastic work, the making of new surface, and outright fracture. All roads lead back to energy. But energy travels by many roads. And a measurement that watches only one of them reports only one province of a continental event. This is the deepest reason the datasheet is not the part and the peak force is not the story.
Part Fourteen. The material is the conversation.
Let’s run the whole progression back. A gas relays a poke by collision slowly, in one channel, forgetting as it goes. A liquid relays by contact faster, forgetting shear unless asked quickly and capable, at a torn surface, of turning a smooth wave into a focused attack. A solid installs permanent wiring, and invents the phonon. The crystal transmits with fidelity and, if metallic, keeps shock absorbers on staff. The polymer edits its answers by rate and temperature. And the glass transmits fast, but scatters the fine detail, hoards energy at hot spots, and, owning no second language for stress, must finally answer overload with a crack. At a speed capped by its own surface-wave courier. And recorded forever in mirror, mist, and hackle.
Which returns us, one last time, to why we poke at all. We are dissipative structures. Built and driven by a flow of energy that we can measure exactly and cannot truly name. And it is in our nature to probe the gradients around us because probing is how such structures find and manage their world. When we poke a material, one energy-processing system questions another. And the material’s whole response elastic and plastic, acoustic and thermal, reversible and final is that second system managing an energy flow on its own terms, according to its own structure, and its own history. Stiffness, sound, heat, damping, and fracture are not five separate properties. They are five dialects of the single thing the conversation is always about.
So here is where I’ll leave you. A material is not a silent, uniform object waiting to be loaded. It is an interconnected energetic system already carrying the story of its making, and its use answering every disturbance with the whole of that story at once. Neighbors speak to neighbors. Structures speak to surfaces. Waves speak to defects. And the present load speaks to the material’s past. What we call material behavior is the sum of that conversation. And if all roads lead back to energy then to listen carefully to a single poke is to catch, for a moment, the one theme that runs through everything connecting the crowded room to the crack tip, the candle flame to the curious hand.
Every failure has a story to tell. Our work is only to learn how to listen.
Thank you for listening. I’m Joseph McFadden. This has been a companion essay to Advanced Glass Technology for Handheld and Industrial Devices. Go poke something. And this time listen to what it tells you.

Why Fluids Kill Polymers
Link to audiobook→ https://www.dropbox.com/scl/fi/xa4hapcgsfht3wjn3jwm0/Threes_company_EMFC_Audiobook_script_28June2026_docx.mp3?rlkey=2qhozd6cwadb3rzbk6hq3mbdp&st=7yroknf5&dl=0
How Fluids Kill Polymers
The Energy-Mediated Fluid Cracking Story
An Audiobook Conversation
Joseph P. McFadden Sr.
June 26th, 2026
Combating engineering mind blindness.
Engineer. Lifelong Learner. Holistic Analyst.
A collaborative effort — decades of my own work, packaged with the assistance of Claude, Anthropic’s AI.
Contents
Author’s Note............................................................................................... 4
Introduction: The Mystery of Energy-Mediated Fluid Cracking........................................................................................................... 7
Why We Need a New Name: From ESC to EMFC................ 9
Part One: Griffith’s Gift—Understanding Fracture Through Energy...................................................................................... 12
The Paradox That Started It All.................................................. 12
The Energy Balance Insight.......................................................... 12
The Criterion for Crack Growth................................................. 13
From Cracks to Crazes.................................................................... 13
Part Two: How Fluids Reduce Surface Energy................ 14
The Nature of Surfaces.................................................................... 14
What Happens When Fluid Replaces Air.............................. 14
The Two Factors That Matter...................................................... 15
Some Quantitative Examples....................................................... 16
Part Three: What Surface Energy Reduction Does..... 17
The Initiation Threshold Drops.................................................. 17
No Surface Is Perfect........................................................................ 17
Crack Growth Accelerates............................................................. 19
The Physical Doorway: Stress and Free Volume............... 19
The Positive Feedback Loop........................................................ 21
Your Insight: Depth and Length................................................. 21
Part Four: The Surprising Complexity of Real-World Exposure....................................................................................................... 23
The Wet Storage Paradox.............................................................. 23
The Acetone Immersion versus Swab Story........................ 24
Part Five: The Dance Between Damage and Protection.............................................................................................................................. 26
The Time Scales Matter.................................................................. 26
The Role of Stress Relaxation...................................................... 26
The Swelling Effect............................................................................ 27
Part Six: What This Means for Testing and Design..... 28
Standard Tests May Mislead........................................................ 28
The Value of Forensic Testing..................................................... 28
Design Strategies That Work....................................................... 28
Service and Maintenance Matters............................................. 30
Part Seven: The Deeper Physics—What Else Is Happening................................................................................................... 31
Effects on Craze Fibrils................................................................... 31
Molecular Mobility Effects............................................................ 31
The Concentration Evolution Effect......................................... 32
Part Eight: Some Final Thoughts on Thermodynamics and Failure.................................................................................................. 33
Thermodynamics Ultimately Governs.................................... 33
Scale Connections Matter.............................................................. 33
Materials Communicate................................................................. 33
The Value of Field Observations................................................ 34
Conclusion: The Story Surface Energy Tells..................... 35
Author’s Note
Hi, my name is Joe McFadden. I’ve spent more than forty years as an engineer, educator, and investigator of failures. I’m offering this content to you, not as a textbook, but as a conversation—with failure itself, with history, and with lived experiences.
Based upon my lived experiences, I found that many failures, failures across many industries, were the result of the failure to incorporate a holistic approach during development.
Let me share the why behind this particular telling. Over the years, the more I’ve chased the why of things—why parts fail, why people do what they do, why the world works the way it does—the more I’ve found that every path leads back to the same place. Energy.
And not energy as some abstract idea, but something more specific: how everything stores energy, moves and manipulates it, and ultimately lets it go—how it dissipates. That thread runs through all of it. It’s how life evolved. It’s how we think—how our minds take in and process information. It’s how we act, how we live, and, in the end, how we pass. It’s the lived experience of you and me. It’s the lived experience of our ancestors, carried forward into us. And it’s every bit as true for the materials we choose and the systems we build—they answer to the same imperative we do.
Consider life itself. One of the most compelling theories of how life arose and grew more complex isn’t really about survival or replication at all—it’s about dissipation. The thinking runs from Schrödinger, yes the cat guy, Schrödinger’s question of what life is, through the work of Ilya Prigogine—the Belgian chemist who earned a Nobel Prize for showing how ordered structures can arise spontaneously in systems held far from equilibrium—and on into more recent thermodynamics. The idea is that complex, living systems may emerge precisely because they are so good at taking in energy and dissipating it, at hurrying the flow of energy from concentrated to spread-out. Life, in this view, is one of the universe’s most elegant ways of dissipating energy.
I’m actually in the middle of this right now. After getting pulled into the idea of dissipative systems—and Prigogine’s work, along with others—I picked up a book called Into the Cool: Energy Flow, Thermodynamics, and Life, by Eric Schneider and Dorion Sagan. Their argument is that the universe is relentlessly driven to break down gradients—differences in the concentration of energy—and that life is one of nature’s most effective ways of doing exactly that. Reading it has only deepened my conviction that this story, too, is at heart a story about energy.
And here’s the most beautiful irony of all. For something so fundamental—something that shapes how we evolved, how we think, how we live and how we pass—we still cannot say what energy actually is. Richard Feynman pointed this out plainly: in all of physics, we have no real definition of what energy is. We know how to count it, measure it, and track it as it changes form, and we know that it’s always conserved. But what it is, at bottom, we do not know. We understand energy entirely by what it does, never by what it is. So all roads lead back to energy. And energy is the one thing we still can’t say we understand.
So I went back to my earlier work on this subject—work that had already brushed up against this idea—and I felt it was time to tell the story properly, through the lens of energy: how it’s stored, how it’s moved, and how it’s let go. Because once you see that everything bends toward energy and its dissipation, what we call environmental stress cracking stops looking like a strange exception and starts looking like one more expression of the rule.
This brings me to today’s discussion, of compatibility of plastic components in the real world.
Ok, let’s start.
How Fluids Kill Polymers
The Energy-Mediated Fluid Cracking Story — An Audiobook Conversation
Introduction: The Mystery of Energy-Mediated Fluid Cracking
Hello. Joe McFadden here. Welcome to what I’m calling my “holistic audiobook” on one of the most fascinating, most frustrating, and most misunderstood failure modes in polymer engineering.
Let me tell you about one of the most insidious, most seemingly-impossible failure modes in polymer engineering: what we traditionally call environmental stress cracking, or ESC. But we’re going to talk about why I think we need a new name—Energy-Mediated Fluid Cracking, or EMFC for short—and why the old name actually obscures what’s really happening. We’re going to understand this phenomenon at a deep level, centering the energy, the thermodynamics, and the molecular interactions that make fluids such deadly agents for polymers.
Picture this: You’ve got a polyethylene storage tank. It’s been holding water under pressure for five years. No problems. The stress analysis shows it’s well within safe limits. The material is chemically resistant to water. Everything should be fine.
Then someone fills it with a detergent solution. Not a strong acid, not a solvent that dissolves polyethylene, just a mild detergent. And within 48 hours, the tank cracks. Catastrophically. Thousands of gallons of fluid on the floor.
Or this: A polycarbonate component in a medical device. Carefully designed, thoroughly tested, performing beautifully in service. Then a technician wipes it with isopropanol during routine cleaning—a procedure that’s been done hundreds of times. And it cracks. Right there, right then. An audible snap, a visible fracture, sudden failure.
What’s going on? The stress didn’t change. The detergent doesn’t dissolve polyethylene. The alcohol doesn’t dissolve polycarbonate. So why do these materials suddenly fail when they contact these fluids?
The answer lies in understanding something fundamental about cracks: they’re not just geometric features, they’re surfaces. And surfaces have energy. And fluids can change that energy. And when they do, they change everything about how cracks grow.
This is the story of energy-mediated fluid cracking through the lens of surface energy and thermodynamics. We’re going to understand why certain fluids cause catastrophic failures, why the specific polymer-fluid pair matters so much, and—here’s where it gets really interesting—why the way you apply the fluid matters as much as what the fluid is.
Because I’m going to share some field observations that reveal complexities you won’t find in textbooks. Things like: why wiping a part with solvent can be more damaging than immersing it. Why repeated brief exposures can be worse than continuous long exposure. Why sometimes heating a part while keeping it wet actually protects it from damage.
These aren’t paradoxes—they’re thermodynamics and kinetics playing out in ways that surprise us if we’re not thinking carefully about what’s really happening.
So let’s dive in. We’re going to talk about Griffith and energy balances, about surface energy and why it matters, about capillary action and fluid penetration, and about some real-world forensic work that reveals how complex this behavior really is.
By the end, you’re going to understand energy-mediated fluid cracking not as some mysterious material defect but as a predictable consequence of thermodynamic principles. And once you understand it, you can design against it, test for it, and prevent it.
Let’s start with why we need a new name for this phenomenon.
Why We Need a New Name: From ESC to EMFC
Okay, so first things first. Why am I calling this “Energy-Mediated Fluid Cracking” instead of the traditional “environmental stress cracking”?
It’s not just semantics. Names matter. The terminology we use shapes how we think about problems. And I’ve come to believe that “environmental stress cracking” is actually a problematic name that obscures the fundamental physics.
First, “environmental” is vague. What does it even mean? The ambient environment? Temperature and humidity? Chemical exposure? All of the above?
In practice, what we’re really talking about is fluid exposure. Specific liquids or sometimes vapors coming into contact with the polymer. Not just “the environment” broadly, but particular chemical species that interact with the polymer in specific ways.
Water is an environment. Air is an environment. But water causes this failure mode in nylon while doing almost nothing to polyethylene. Air generally doesn’t cause it at all. So “environmental” is too broad, too nonspecific.
If we say “fluid cracking,” we’re immediately more precise. We’re pointing attention to the right place: which fluids, which polymers, what’s the interaction?
Second, we’ve got “stress” appearing twice—once explicitly in “stress cracking” and implicitly in the fact that we’re talking about stressed components. But here’s the thing: stress is necessary but it’s not the primary variable that changes.
Think about it. You’ve got a component under stress. It’s carrying load. Let’s say twenty megapascals—a nice moderate stress level, well within the design limits, nothing dramatic. And this component sits there in air for years. No problem. The stress hasn’t caused failure.
Now that same component, same stress level, contacts a particular fluid. And within hours or days, it cracks. Catastrophically.
What changed? The stress didn’t change. It’s still twenty megapascals. The mechanical loading situation is identical.
What changed is the energy landscape. The thermodynamic balance that determines whether crack growth is favorable or not. And that change was mediated by the fluid.
So emphasizing “stress” twice in the name kind of misses the point. Yes, stress is necessary—you need tensile stress to drive crack opening. But stress alone wasn’t causing failure. The fluid fundamentally altered what stress level is safe versus dangerous.
Third, and this is the big one: the traditional name tells us nothing about the mechanism. It’s purely descriptive. “Under stress, in an environment, cracking happens.” Okay, but why? What’s the physical process?
Compare this to other well-named phenomena. “Stress corrosion cracking”—okay, corrosion is the mechanism, it’s an electrochemical process, we know what’s happening. “Hydrogen embrittlement”—hydrogen is entering the material and affecting crack growth, mechanism identified.
But “environmental stress cracking”? It just describes the conditions—stress plus environment—without explaining the causation. It’s like naming a disease “sick person syndrome.” Descriptive but not explanatory.
So here’s what I’m proposing: Energy-Mediated Fluid Cracking. EMFC for short.
“Energy-Mediated” puts the mechanism front and center. This is about energy. Specifically, it’s about how fluids alter the energy balance that governs fracture. They reduce the energy cost of creating crack surfaces, which shifts the thermodynamic equilibrium toward crack growth. Energy is the lens through which we understand this phenomenon.
When you hear “energy-mediated,” you’re immediately thinking thermodynamics. You’re thinking energy balance, energy barriers, energy landscapes. That’s exactly the right mental framework.
“Fluid” specifies the agent. Not “environment” vaguely, but fluids specifically. This directs attention to the critical question: which fluids interact with which polymers to create the energy change we’re talking about?
“Cracking” is the outcome. We’re talking about crack propagation, fracture, material separation. Clear and specific.
So: Energy-Mediated Fluid Cracking. The mechanism, the agent, the result. All in the name.
Why this matters: the name shapes how we think about the problem. If we call it “stress cracking,” we focus on stress reduction. And yes, reducing stress helps—I’m not saying it doesn’t. But we might miss that material selection based on surface energy properties is equally important. We might miss that the specific fluid matters enormously.
If we call it “environmental” cracking, we might think broadly about “harsh environments” rather than specifically about molecular interactions between fluids and polymers.
But if we call it “energy-mediated fluid cracking,” we’re immediately asking the right questions:
• What’s the surface energy of this polymer?
• How much does this fluid reduce that surface energy?
• What’s the energy balance—is crack growth favorable?
• Can we modify the energy landscape through material choice, coatings, barriers?
The name guides the thinking. The thinking guides the solution.
So throughout this audiobook, I’m going to use EMFC when I’m talking about the phenomenon mechanistically. I’ll still say ESC when I’m referencing historical literature or established test standards—we can’t just ignore decades of accumulated knowledge. But conceptually, we’re thinking EMFC.
Energy-mediated. That’s the key. The fluids are mediating an energy change that enables crack growth.
Okay, with that established, let’s build the foundation. Let’s talk about Griffith.
Part One: Griffith’s Gift—Understanding Fracture Through Energy
The Paradox That Started It All
In the early 1920s, there was a problem. A big problem. Engineers could calculate, from basic atomic bond strengths, how strong materials should be. The theoretical strength—the stress required to literally rip atoms apart—was enormous. Materials should be incredibly strong.
But they weren’t. Glass, in particular, was failing at stresses sometimes 100 times lower than theoretical strength predicted. A hundred times! That’s not a rounding error. That’s a fundamental disconnect between theory and reality.
Allan Griffith, working on this problem, had a crucial insight. He realized that everyone was asking the wrong question. They were asking “how much stress does it take to break bonds?” But Griffith asked a different question: “What’s the energy balance during crack formation?”
The Energy Balance Insight
Here’s Griffith’s logic, and it’s beautiful in its simplicity.
When a crack forms, or when an existing crack grows, two things happen energetically.
First, you create surfaces. A crack has two faces—upper and lower. Those faces are new surfaces that didn’t exist before. Creating surfaces requires energy. Why? Because molecules at a surface are in a higher energy state than molecules in the bulk. They’re missing neighbors on one side. They have unsatisfied bonds, unsatisfied molecular interactions. That costs energy.
We call that energy cost “surface energy,” denoted by the Greek letter gamma. It’s measured in energy per unit area—something like millijoules per square meter. Every material has a characteristic surface energy. For polymers, it’s typically thirty to fifty millijoules per square meter.
So if you extend a crack by a little bit—call it d-a—you create new surface area. For a crack of unit thickness, you’re creating two times d-a of new surface on each face, times two faces, so four times d-a total. The energy required is four gamma times d-a.
Second, you release strain energy. The material around a crack is under stress. That stress stores elastic energy, like a compressed spring stores energy. When the crack extends, material that was previously loaded becomes unloaded—it’s now inside the crack, stress-free. The strain energy that was stored in that material is released.
For a crack in an infinite plate under stress sigma, the strain energy released when the crack extends by d-a is pi times sigma squared times a, divided by E, all times d-a—where E is the elastic modulus and a is the crack half-length.
The Criterion for Crack Growth
Griffith said: the crack grows when the energy released equals or exceeds the energy required. When the strain energy you get back is enough to pay for creating the new surfaces.
This gives you a critical stress:
Sigma-c equals the square root of two E gamma, over pi a.
Look at what this equation tells us. Three profound insights:
One: Fracture stress depends on crack size. Bigger cracks fail at lower stress. That’s the square root of a in the denominator. This explained why real materials with flaws failed at stresses far below theoretical strength—the flaws acted as crack initiators.
Two: Fracture stress depends on surface energy. That’s the gamma under the square root. Higher surface energy means higher fracture resistance. The material is harder to crack because creating surfaces is more expensive energetically.
Three: Stiffer materials resist fracture better. That’s the E under the square root. Stiffer materials store more strain energy for a given stress, so they have more energy available to drive crack growth, but it turns out that relationship is favorable overall.
But for us, for understanding EMFC, insight number two is the critical one. Surface energy directly controls fracture resistance.
And here’s the key: if you reduce surface energy, you reduce fracture resistance.
That’s the whole game. That’s why EMFC happens. Fluids reduce surface energy, making it easier—energetically cheaper—to create cracks.
From Cracks to Crazes
Now, Griffith was working with glass—brittle, elastic materials. But the framework extends beautifully to polymers and crazing.
A craze isn’t quite a crack. It’s not empty space. It’s a network of polymer fibrils bridging across voids. About 50% void, 50% stretched polymer. But those voids represent surfaces—polymer-air interfaces. Creating a craze requires creating all that void surface area.
The total energy to create a craze includes not just surface energy but also the work to stretch and orient polymer chains into fibrils, and the energy to partially disentangle chains at the craze tip. It’s more complex than a clean brittle crack.
But surface energy remains a critical component. And reducing surface energy still lowers the energy barrier to craze formation and growth. The fundamental principle holds.
Part Two: How Fluids Reduce Surface Energy
Okay, so surface energy matters. But how do fluids reduce it? What’s the physical mechanism?
The Nature of Surfaces
First, let’s understand what surface energy is, physically. Why do surfaces have excess energy at all?
Think about a molecule in the bulk of a material. It’s surrounded by neighbors in all directions—left, right, up, down, forward, back. All those neighbors are interacting with it through various forces: van der Waals forces, dipole interactions, maybe hydrogen bonds. The molecule is in a satisfied state, energetically. All its interaction sites are engaged.
Now think about a molecule at a surface. It’s still got neighbors on the bulk side, but on the surface side? Nothing. Air. Vacuum. Whatever, but not more material. That molecule has unsatisfied interaction sites. It’s in a higher energy state than the bulk molecules.
That excess energy, summed over all the surface molecules and divided by surface area, is the surface energy. It’s literally the energy cost of having a surface instead of bulk.
For a polymer-air interface, that surface energy reflects the unsatisfied molecular interactions at the polymer surface. Typical values: thirty to fifty millijoules per square meter for most common polymers.
What Happens When Fluid Replaces Air
When a fluid contacts that polymer surface—gets into a crack, wets a craze—it replaces the polymer-air interface with a polymer-fluid interface.
The energy of that new interface depends on how well the fluid molecules interact with the polymer molecules. If they interact strongly—if there’s good adhesion between polymer and fluid—the interface has low energy. The polymer surface molecules are satisfied, or at least more satisfied than they were facing air.
The thermodynamic relationship is the Dupré equation:
The work of adhesion, W-A, equals gamma-P-A, plus gamma-F-A, minus gamma-P-F.
Where W-A is the work of adhesion—the energy required to separate the polymer-fluid interface; gamma-P-A is the polymer-air surface energy; gamma-F-A is the fluid-air surface tension, the fluid’s own surface energy; and gamma-P-F is the polymer-fluid interfacial energy.
Rearranging this, the reduction in surface energy when fluid replaces air is:
Delta gamma equals gamma-P-A minus gamma-P-F, which is the same as W-A minus gamma-F-A.
This simple equation tells us everything about which fluids will be aggressive EMFC agents and which won’t.
The Two Factors That Matter
Factor One: Work of Adhesion, W-A. How strongly does the fluid stick to the polymer? Strong adhesion means high W-A, which means large surface energy reduction.
What creates strong adhesion? Molecular similarity. “Like dissolves like,” the old chemistry saying, applies here. Fluids with molecular structures similar to the polymer create strong interactions.
Polyethylene is a nonpolar hydrocarbon chain. So are many oils, greases, and detergents (which contain long hydrocarbon chains). These fluids adhere well to polyethylene, creating high W-A, causing large surface energy reduction.
Polycarbonate is an aromatic ester polymer. Organic solvents with aromatic rings or ester groups—things like toluene, acetone, esters—interact strongly with PC, creating high W-A.
Water? Water is highly polar. It doesn’t interact well with nonpolar polymers like PE or PP. Low W-A, minimal surface energy reduction, little EMFC effect. But water does interact with polar polymers like nylon (through hydrogen bonding), so water can cause EMFC in nylon even though it’s harmless to PE.
The specificity of EMFC comes from this molecular interaction specificity. Particular fluids attack particular polymers based on molecular compatibility.
Factor Two: Fluid Surface Tension, gamma-F-A. The fluid’s own surface tension matters too. Lower surface tension fluids are generally more effective.
Water has high surface tension—about seventy-two millijoules per square meter. Organic solvents have much lower surface tensions, twenty to forty millijoules per square meter. This is part of why organic solvents are more aggressive EMFC agents than water for most polymers.
But here’s where it gets really interesting: surfactants. Surface-active agents, like the detergents in that polyethylene tank story. Surfactants are molecules with one end that likes water and one end that likes oil. They concentrate at interfaces and dramatically lower surface tension.
A detergent solution might have surface tension below thirty millijoules per square meter—less than half of pure water. And detergents often have long hydrocarbon chains that interact favorably with polymers. So they achieve both high W-A (good adhesion) and low gamma-F-A (low fluid surface tension). Double whammy. Extremely effective EMFC agents.
This is why detergents, soaps, cleaning solutions—mild, innocuous-seeming fluids—are so dangerous to stressed polymers. They’re optimized, almost by accident, to reduce surface energy dramatically.
Some Quantitative Examples
Let me give you numbers to make this concrete.
• Polyethylene to air: gamma-P-A is about thirty-five millijoules per square meter.
• Polyethylene to water: gamma-P-F is about thirty millijoules per square meter—a small reduction; water doesn’t wet PE well.
• Polyethylene to detergent solution: gamma-P-F is about fifteen to twenty millijoules per square meter—a huge reduction; detergent lowers surface tension and wets PE.
• Polyethylene to oil: gamma-P-F is about five to ten millijoules per square meter—a massive reduction; oil is very similar to PE molecularly.
So a detergent solution reduces surface energy by forty to fifty percent. An oil might reduce it by seventy to eighty percent. These are enormous changes in the energy balance.
• Polycarbonate to air: gamma-P-A is about forty-two millijoules per square meter.
• Polycarbonate to water: gamma-P-F is about thirty-eight millijoules per square meter—a small reduction; water barely affects PC.
• Polycarbonate to isopropanol: gamma-P-F is about twenty-five millijoules per square meter—a moderate reduction; alcohol partially wets PC.
• Polycarbonate to acetone: gamma-P-F is about ten millijoules per square meter—a large reduction; acetone strongly interacts with PC.
Acetone reduces PC surface energy by seventy-five percent. That’s why a drop of acetone on stressed PC can cause instant cracking. The energy barrier to crack growth just collapsed.
Part Three: What Surface Energy Reduction Does
Now we understand that fluids reduce surface energy. Let’s understand what that reduction does to crack growth.
The Initiation Threshold Drops
Remember the Griffith equation: sigma-c equals the square root of two E gamma over pi a. Critical stress is proportional to the square root of surface energy. Reduce surface energy, and you reduce the stress required for crack growth.
Let’s work through an example. Suppose you’ve got a polymer part under stress—let’s say sigma equals twenty megapascals. And suppose in air, the critical stress for crack growth from existing flaws is twenty-five megapascals. You’re safe. Twenty is less than twenty-five. No crack growth.
Now introduce a fluid that reduces surface energy by 50%. The new critical stress is:
Sigma-c in fluid equals sigma-c in air, times the square root of zero point five, which is about zero point seven oh seven, times twenty-five megapascals—roughly seventeen point seven megapascals.
Now your applied stress, twenty megapascals, exceeds the critical stress, seventeen point seven megapascals. The crack that was stable in air becomes unstable in the fluid environment. Crack growth begins.
The fluid didn’t add stress. It didn’t mechanically weaken the material. It simply changed the thermodynamic stability criterion. What was safe became unsafe.
This is why EMFC is so insidious. The part was fine. The stress didn’t change. But the environment changed, and suddenly fracture becomes thermodynamically favorable.
No Surface Is Perfect
Before we talk about how an existing crack grows, let’s back up and ask a basic question: where does that existing crack come from? Because here’s the thing—no surface is perfect. Not one. Every real surface, on every real part, is covered in microscopic flaws.
Think back to Griffith. Remember how glass failed at stresses a hundred times below its theoretical strength? That gap exists precisely because real materials are riddled with tiny pre-existing cracks. The theoretical strength assumes a perfect, flawless solid. Reality never hands you one.
So where do these flaws come from? Everywhere. Processing is a big source—molding, extrusion, and machining leave behind microscopic voids, weld lines, frozen-in stresses, gate marks, and fine surface scratches. Handling adds more: every time a part is touched, wiped, or set down, it picks up abrasion marks. And then there’s the material itself—at the molecular scale, polymers have density fluctuations, chain ends, additive and filler particles, and, in semicrystalline plastics, boundaries between spherulites. Every one of those is a potential crack starter.
How big are these flaws? They span an enormous range. The smallest reside down at the nanometer scale—a few millionths of a millimeter. The ones that matter most for cracking are usually bigger, somewhere from a fraction of a micrometer up to tens, even hundreds, of micrometers. In fact, engineers often model a polymer as if it contains a built-in “inherent flaw” on the order of tens of micrometers—small enough to be invisible to the eye, large enough to be dangerous.
Here’s the key point: you don’t have to create a crack to have a crack. You already have thousands of them, everywhere, on every surface, before the part ever goes into service.
Now here’s something people tend to forget: air is a fluid. In physics, a fluid is anything that flows—and that includes gases, not just liquids. So a part sitting quietly “in air” is actually sitting in a fluid environment. And air is never just air. It carries water vapor—humidity—along with oxygen and whatever else happens to be floating around.
And over time, that air, and the water it carries, works its way into those microscopic fissures. The gaps are so small that capillary forces draw the vapor in and pull it right down to the crack tip. In the very smallest cracks, water vapor can even condense into liquid water when the surrounding air is nowhere near saturated—a quirk of physics that shows up specifically in nanoscale gaps. The crack, in effect, wicks moisture straight out of the air.
And here’s a detail worth pausing on, because it ties the whole story together: that capillary pull—that wicking—isn’t some separate force. It’s surface energy again. A liquid is drawn into a tiny gap because moving in lowers the total energy of the system: it trades a high-energy solid-and-air interface for a lower-energy solid-and-liquid one, and the liquid spreads to wet the walls. Whether a fluid wicks in at all comes down to whether it wets the surface—and that is set by the very same balance of surface energies we’ve been discussing. The narrower the gap, the stronger the pull, which is why the smallest cracks, down at the nanometer scale, draw fluid in most fiercely of all.
So surface energy is doing double duty here. It decides whether the fluid can even reach the crack tip—the delivery—and then it decides whether the crack will grow once the fluid arrives—the damage. Same physics at both ends of the process. All roads, again, lead back to energy.
So that “existing crack” we’re about to discuss? It was never truly empty. It was never sitting in a perfect vacuum. Its surfaces are already wetted—by air, by adsorbed water, by whatever the part has been breathing in. The energy balance at that crack tip is already a polymer-to-humid-air balance, not a polymer-to-nothing balance. It’s just a slow, mild version of the very same process we’ve been describing. Introduce a more aggressive fluid, and you don’t start the process—you pour fuel on a fire that’s already quietly smoldering.
Crack Growth Accelerates
For an existing crack that’s already growing, surface energy reduction affects growth rate. Crack growth rate typically follows some power law relationship between driving force and resistance:
The crack-growth rate, d-a by d-t, equals A times the quantity G minus G-c, raised to the power n.
Where G is the energy release rate (the driving force), G-c is the critical energy release rate—the resistance, related to surface energy by G-c equals two gamma—and n is some exponent typically between two and four.
When you reduce G-c (by reducing gamma), the difference, G minus G-c, increases. And because of that power-law relationship, crack growth rate can increase by factors of ten, a hundred, even more for modest reductions in surface energy.
A crack that was growing slowly, maybe a few micrometers per day in air, might grow at millimeters per hour in an aggressive fluid. That’s the difference between a crack that takes years to become critical and a crack that causes failure in hours.
The Physical Doorway: Stress and Free Volume
Before we look at how this all accelerates, we need to talk about what the stress is actually doing at the molecular scale.
We’ve talked about stress as the driving force—the stored elastic energy waiting to be released. But stress isn’t just a force pulling the crack open. It does something structural to the polymer itself. It opens the physical doorway for the fluid.
To understand this, we have to talk about “free volume.”
Think of a polymer not as a solid, impenetrable block of plastic, but as a dense, microscopic bowl of cooked spaghetti. Even when those polymer chains are tightly packed together, there is empty space between them. That empty space is the free volume. It’s the wiggle room that allows chains to move and slide.
When you apply a tensile stress to a polymer, you are literally pulling those chains apart. You are expanding the material. And in doing so, you are increasing that free volume. The intermolecular gaps widen.
This happens everywhere the part is under tension, but it is dramatically magnified at stress concentrations and right at the tip of an existing flaw. The local free volume in those highly stressed regions spikes.
Why does this matter for EMFC? Because fluid molecules need physical space to move.
In an unstressed polymer, the free volume is relatively low. The gaps are tight. Fluid diffusion is slow, sometimes nearly nonexistent. But when you add stress, the polymer dilates. The physical pathways between the polymer chains literally widen.
You aren’t just applying a mechanical load; you are unbarring the door. The stress physically invites the fluid in.
And remember how fluids act in narrow spaces? Those tiny, newly expanded nanometer-scale gaps create enormous capillary pull. The fluid rushes into this expanded free volume, driving straight between the polymer chains.
And this is where we run into a real-world situational comedy.
If you remember the old TV show Three’s Company, you know that the entire premise relies on an interloper and a highly specific situation where misunderstandings lead to total chaos. EMFC is exactly that—a situational comedy, but in the classical, structural sense. For the chaos to unfold, the setup has to be perfect.
Here is the situation: Let’s imagine two of those long polymer chains within our stressed matrix. They are entangled and deeply attracted to one another through weak intermolecular forces. Energetically, they are stable. They are carrying the load together.
Then, the stress pulls them slightly apart, creating just enough free volume for our interloper to enter—the fluid molecule.
Now, because of that “like dissolves like” rule we discussed earlier, this interloper is molecularly similar. It is highly attractive to the polymer chains. So, it slides right into that newly opened space.
Here is the fatal misunderstanding: The polymer chains are energetically drawn to the interloper. They satisfy their local surface energies by bonding with the fluid instead of each other. But the interloper is too short. It can’t entangle. It cannot carry the mechanical load.
The fluid satisfies the surface energy, but it destroys the structural cohesion. The interloper drops the energy barrier so low that the chains simply slip past one another.
The punchline of this situational comedy isn’t laughter. It is a sudden, catastrophic shift in the thermodynamic balance. The stress opened the door, the interloper changed the energy accounting, and the material fails.
This is why the combination is so potent—and why processing and design matter so much in practice. Injection molding often creates a compressive outer skin with reduced free volume, nature’s protective layer. But around gates, at sharp transitions, in overmolded areas, or where assembly puts surfaces into tension, that protection disappears. Free volume spikes locally under load. Those are the exact locations where the door opens widest for aggressive fluids. Field failures almost always start there.
Which leads us directly to how this process feeds on itself.
The Positive Feedback Loop
And here’s where it gets really dangerous: crack growth and fluid penetration create a positive feedback loop.
• Step 1: You’ve got a stressed part with some small crazes or surface flaws. In air, they’re stable or growing very slowly.
• Step 2: The part contacts an EMFC-active fluid. The fluid wets the external surface.
• Step 3: Capillary forces pull fluid into the craze void networks. Those voids are small—nanometers to micrometers—so capillary pressures are enormous. Fluid penetrates rapidly, driven by those capillary forces.
• Step 4: Fluid reaches the craze tips—the active growth zones. Surface energy drops at those critical locations.
• Step 5: With reduced surface energy, crazes grow faster. They widen (more void formation) and lengthen (advancing into bulk material). This creates more void space, more pathways.
• Step 6: The enlarged voids provide even better fluid access. More fluid penetrates deeper. More craze tips get wetted.
• Step 7: Back to Step 5, but now with even more surface area wetted, even more crack tips advancing.
This is self-accelerating. It’s a runaway process. Once it starts, it feeds itself, getting faster and faster until something breaks.
This positive feedback explains the catastrophic nature of EMFC failures. They’re not gradual. They’re not linear. They accelerate. The material doesn’t slowly degrade—it suddenly, rapidly fails once the feedback loop gets going.
Your Insight: Depth and Length
And here’s where your insight about depth and length comes in, and it’s spot-on.
Consider a craze that’s reached some stable configuration in air. It has a certain depth into the material, a certain length along the stress direction. This configuration represents an energy balance: strain energy released equals surface energy created.
Now introduce fluid that reduces surface energy by, say, 50%. The existing configuration is no longer at equilibrium. You’ve reduced the energy cost per unit surface area, but the strain energy released hasn’t changed. The equation is out of balance.
To restore balance, you need more surface area. How do you get more surface area? The craze deepens—it advances further into the material, creating more void volume, more fibril surface area, more interfaces. The craze lengthens—it extends longer in the stress direction, creating more craze length, more total area. And typically you get both deepening and lengthening, because both create the additional surface needed to balance the energy equation.
Quantitatively, if surface energy drops by half, the equilibrium surface area must double (at constant stress). So a craze that was depth d and length l might grow to depth root-two times d and length root-two times l, because area scales as d times l, and root two times root two equals two.
This is why fluids don’t just initiate cracks—they actively drive crack growth to greater depths and lengths. The thermodynamic balance demands it.
Part Four: The Surprising Complexity of Real-World Exposure
Now here’s where theory meets practice, and practice reveals complexities that theory alone wouldn’t predict. I’m going to share some field observations—forensic work, troubleshooting, real failure investigations—that show how energy-mediated fluid cracking behaves in service conditions. And some of these behaviors are counterintuitive until you understand what’s really going on.
The Wet Storage Paradox
Here’s an observation from troubleshooting PC and PC/ABS electronic housings with assembly-induced stress.
Wipe and dry: Take the device, wipe it with solvent-saturated cloth, let it dry. Repeat daily. Result: cracks develop within weeks.
Wet storage: Take an identical device, wrap it in a wet wipe soaked with the same solvent, seal it in a bag, store at forty degrees Celsius for forty-eight hours. Result: some surface damage, stress whitening, but no through-cracks. Device still functional.
Wait—what? The wet storage exposes the part to fluid continuously for 48 hours at elevated temperature. The daily wiping exposes it to fluid for seconds per day at ambient temperature. The wet storage should be more aggressive, right? Wrong. And here’s why.
What happens during wet storage: in the first few minutes to hours, fluid penetrates surface-connected flaws and crazes. Surface energy drops. Initial crack growth begins. But simultaneously, several protective mechanisms activate.
Plasticization: The fluid plasticizes the surface layers. Polymer chains gain mobility. This allows stress relaxation—the material creeps slightly, redistributing stress from peak values to surrounding regions. Peak stress decreases over time.
Swelling: If the fluid causes even modest swelling (volume expansion of the polymer), the swollen surface layers are constrained by the unswollen interior. This creates compressive stresses at the surface—compressive stress directly counteracts the tensile stress driving crack growth.
Equilibration: After hours to days at forty degrees Celsius, the system reaches equilibrium. Cracks have grown to some depth where energy balance is satisfied. Fluid has penetrated, stress has relaxed, and further crack growth stops because the driving force (reduced by relaxation) no longer exceeds the resistance (reduced by surface energy, but now at equilibrium).
The damage stabilizes. Yes, there are crazes. Yes, there’s stress whitening. But the crack depth is only tens or hundreds of micrometers—not enough to cause failure in a part with millimeter-scale walls.
What happens with cyclic wiping is different. Day 1: Fluid applied. Penetrates surface flaws. Surface energy drops. Crack growth begins. But before equilibration, the fluid evaporates. Surface dries. Surface energy partially recovers. Stress relaxation limited because exposure time was brief.
Day 2: Fresh fluid applied to an already-damaged surface. Fluid penetrates to previous crack depths rapidly (pathways already open) and extends deeper. Surface energy drops at new, deeper locations. Crack grows from the previous front. Dries again.
Days three through thirty: Each cycle advances damage incrementally deeper. Each fresh application re-activates surface energy reduction at progressively deeper crack fronts. The system never reaches equilibrium because you keep refreshing the fluid at new locations. After thirty cycles, cracks have grown one hundred to two hundred micrometers or more. Critical crack depth is reached. Component fails.
The cyclic nature prevents the protective equilibration that occurs in continuous immersion. Each application is a fresh attack. Stress relaxation doesn’t help because stress returns during the dry period. The system can’t settle into a stable state.
Why does elevated temperature (forty degrees Celsius) during wet storage actually help? Because it accelerates the protective mechanisms more than the damage mechanisms. At forty degrees Celsius: stress relaxation is five to ten times faster (exponential temperature dependence); plasticization effects develop faster and penetrate deeper; the system reaches equilibrium quickly—hours instead of days; and swelling effects may be enhanced, creating stronger protective compression.
The race between crack growth and stress relaxation/equilibration is won by the protective mechanisms at elevated temperature with continuous exposure. By the time the system equilibrates, cracks haven’t grown critically. But at ambient temperature with cyclic exposure, protective mechanisms never get a chance to win. Each cycle is too brief for relaxation, and cycles repeat before equilibration occurs.
The Acetone Immersion versus Swab Story
Here’s another observation from field testing. Two identical PC/ABS devices with assembly stress.
Device 1—Immersion: Complete device dunked in acetone for 30 seconds, removed, dried, inspected. Result: Surface crazing visible, stress whitening in high-stress regions, but no through-cracks. Device functional.
Device 2—Swab test: Cotton swab saturated with acetone, applied to a corner region where FEA showed a stress concentration of twenty-five megapascals. Brief application, maybe five seconds. Result: Audible crack—snap!—visible fracture propagating from the corner within seconds.
Same fluid, same part, but vastly different outcomes. What gives?
Immersion (global exposure): When you immerse the whole device, you expose the entire surface uniformly. Acetone plasticizes everywhere simultaneously. Before significant crack growth can occur at any specific location, stress relaxation begins throughout the stressed volume. Any crack initiation is distributed among many potential sites—every stress concentration, every flaw. Surface energy reduction is uniform, but so is stress relief. No single location experiences optimal conditions for crack growth before protective mechanisms engage. The result: distributed superficial damage, but no single crack achieves critical size.
Swab test (localized application): The swab delivers fluid specifically to one location—the highest stress region, identified by analysis. This creates optimal worst-case conditions: maximum stress (twenty-five megapascals at the stress concentration); fresh, concentrated fluid (saturated swab); no time for stress relaxation (application duration seconds); all the aggressive factors without any protective factors.
It’s like the difference between heating an entire glass beaker slowly (uniform thermal stress, no fracture) versus touching one spot with an ice cube (localized thermal shock, instant fracture).
The localized application is dramatically more aggressive because it combines maximum stress with maximum chemical attack without allowing protective mechanisms to activate. The lesson: how you apply fluid matters as much as what the fluid is. Distributed exposure can be less damaging than localized exposure because protective mechanisms have time to engage globally before damage localizes.
Part Five: The Dance Between Damage and Protection
What these field observations reveal is something subtle: EMFC isn’t just about crack growth. It’s about a competition between damage mechanisms (crack growth, fibril breakdown) and protective mechanisms (stress relaxation, equilibration, possibly swelling-induced compression).
The Time Scales Matter
Different processes happen at different rates.
• Very fast (seconds to minutes): fluid wetting of external surfaces; initial capillary penetration into surface-connected voids; surface energy reduction at fluid-wetted interfaces.
• Fast (minutes to hours): deeper capillary penetration into crack networks; initial plasticization of surface layers; beginning of stress relaxation in plasticized regions.
• Moderate (hours to days): full plasticization penetration to relevant depths; substantial stress relaxation throughout the stressed volume; the system approaches equilibrium; swelling effects fully develop (if swelling occurs).
• Slow (days to weeks): complete equilibration at given temperature; potential fluid degradation or compositional changes; long-term creep and stress redistribution.
The outcome depends on which processes dominate in the available time. Short exposure (seconds to minutes): damage mechanisms dominate. Surface energy reduction is fast. Crack growth begins immediately. Protective mechanisms haven’t engaged. Most aggressive scenario. Intermediate exposure (hours): competition between damage and protection. Depends on temperature, fluid effectiveness, stress level, material properties. Could go either way. Long exposure (days): if exposure is continuous, protective mechanisms can win and the system equilibrates; if exposure is cyclic (fresh fluid repeatedly applied), damage dominates because equilibration never occurs.
The Role of Stress Relaxation
Stress relaxation deserves special attention because it’s the primary protective mechanism.
Polymers are viscoelastic. Under sustained load, they creep—deform gradually over time. This creep redistributes stress from peak locations (stress concentrations) to broader regions.
The relaxation time depends on temperature and molecular mobility. At room temperature, relaxation in an unplasticized glassy polymer might take weeks. At forty degrees Celsius, maybe days. In a plasticized polymer (one that’s absorbed fluid), relaxation accelerates dramatically—maybe hours or even minutes.
This is why wet storage at forty degrees Celsius can be protective. The combination of temperature and plasticization creates fast relaxation. Stress drops from, say, twenty-five megapascals to fifteen megapascals within hours. At fifteen megapascals, even with reduced surface energy, crack growth rate is much slower. Equilibrium is reached before critical crack depth.
But cyclic exposure at ambient temperature doesn’t allow this. Each exposure is too brief for meaningful relaxation. And during drying, elastic recovery restores stress. The next cycle starts again at high stress.
Materials with faster intrinsic stress relaxation behavior resist cyclic EMFC better, even if their crack growth rates in fluid are similar to other materials. The ability to “relax away” the driving force provides margin that materials without good relaxation don’t have.
The Swelling Effect
We’ve mentioned swelling, but let’s think about it more carefully.
If a fluid causes polymer to swell—increase in volume from fluid absorption—the swollen region wants to expand. But if swelling is localized to surface layers (fluid hasn’t penetrated deeply), the unswollen interior constrains the swollen surface. This constraint creates compressive stress at the surface.
Compressive stress opposes tensile stress. If you’ve got twenty megapascals of tensile stress from applied loads, and swelling creates ten megapascals of compressive stress, the net tensile stress drops to ten megapascals. Lower stress means lower crack driving force.
This is a protective effect. Materials that swell moderately in EMFC-active fluids might actually gain some protection from swelling-induced compression, even though swelling also indicates fluid absorption and plasticization.
The magnitude of this effect depends on how much swelling occurs (higher swelling → more compression), how localized the swelling is (surface swelling only → strong constraint; bulk swelling → no constraint), and the modulus of swollen versus unswollen material. This is subtle stuff, difficult to predict without experiments, but it’s part of the complex competition between damage and protection.
Part Six: What This Means for Testing and Design
These observations—the paradoxes, the complexities, the competitions—have profound implications for how we test materials and design components.
Standard Tests May Mislead
The typical EMFC test protocol: immerse stressed specimen in fluid, measure time to failure. This test captures fluid aggressiveness under one specific condition—continuous immersion.
But if service conditions involve cyclic exposure—cleaning, wiping, intermittent splashing—continuous immersion tests may significantly overestimate service life. Cyclic field exposure can be far more aggressive than lab immersion.
Recommendation: Supplement immersion tests with cyclic exposure protocols. Apply fluid, allow drying, repeat. See if failures occur that immersion tests don’t reveal. Also consider localized application tests—swab tests, drop tests—especially for components where fluid contact is localized in service. These “worst case” tests may reveal vulnerabilities that global immersion misses.
The Value of Forensic Testing
Using FEA to identify high-stress locations, then deliberately attacking those locations with swabs or localized application, is powerful forensic work. You’re creating optimal conditions for failure: maximum stress (from FEA); maximum chemical attack (fresh, concentrated fluid); minimum protection (brief exposure, no relaxation time).
If the part survives this worst-case testing, it’s probably safe in milder service conditions. If it fails, you’ve identified the critical location and can redesign (reduce stress) or change materials. This is like destructive testing in metallurgy—you’re deliberately failing parts to understand failure mechanisms and margins.
Design Strategies That Work
Understanding the mechanisms suggests design strategies.
• Reduce peak stress: always. Lower stress reduces crack driving force and provides margin even when surface energy is reduced. Use FEA to find and mitigate stress concentrations. Generous radii, smooth transitions, avoid sharp corners.
• Design for drainage: if components contact fluids, design so fluids drain quickly and completely. Don’t let fluids pool or get trapped in crevices near high-stress regions. Rapid drainage limits exposure time, reduces damage per cycle.
• Seal critical regions: if possible, isolate high-stress regions from fluid contact. Gaskets, O-rings, barriers, conformal coatings—physical separation can be highly effective.
• Choose materials wisely: not just chemical resistance (immersion resistance) but also stress relaxation behavior. Materials that relax quickly may better resist cyclic EMFC. Impact-modified polymers often have better relaxation than rigid grades.
• Minimize residual stress: processing-induced stress adds to service stress. High residual stress leaves less margin. Optimize processing—slow cooling, lower packing pressure, proper gate design.
• Rethink assembly: snap-fits and press-fits create sustained stress. Can you redesign to eliminate sustained stress? Threaded fasteners, adhesives, alternative geometries?
Now let me pause here, because if we’re talking about residual stress, there’s a question some of you are already forming. I get asked it every so often, and it goes like this: so residual stress is the problem? Well then—why not just anneal it out? I read somewhere that you heat the part up, the stress relaxes, and you’re done. Problem solved. And honestly, that’s a fair question. A really fair question. But my answer comes with a why, and the why is this: a plastic component’s response to its environment depends on its lived experience.
See, during molding, the part is born into a story it never forgets. Hot melt hits a cold mold. The surface freezes first, almost instantly, while the core is still molten. Then the core cools, and as it cools it wants to shrink—but the skin has already hardened and won’t let it. That tug-of-war freezes a compressive stress into the surface layer. And that compressive skin is, in a very real sense, the part’s memory of how it was made. Now here’s the beautiful part: that compressive skin is often protective. Remember, EMFC attacks the surface, and crazes need tension at the surface to open up. A compressive skin squeezes those surface flaws shut. It’s the part holding its own cracks closed, using the very stress it was born with.
Now you can see the trap with annealing. When you heat that part up to relax the stress, you don’t get to choose which stress relaxes. The molecules don’t know which stresses you happened to like. The harmful frozen-in tension relaxes, yes—but so does that protective compressive skin. Annealing is a blunt instrument. It erases the part’s lived experience, the good along with the bad. And here’s the twist that makes it trickier still: that protective skin isn’t even guaranteed in the first place. Depending on how hard the part was packed and how it cooled, the surface might have ended up in tension instead—which is the harmful case. So you can’t actually know whether annealing will help you or hurt you until you know that particular part’s history—until you know its lived experience.
And there’s one more wrinkle, because I want to be straight with you. You’ll find studies that say annealing improves stress-cracking resistance—and they’re not wrong. But here’s the catch: when you hold a polymer like polycarbonate just below its glass transition temperature, you’re not only relaxing stress. You’re also aging it. The molecules settle and pack a little tighter, they form new entanglements, the material quietly densifies. So those studies are often measuring two things at once—a little stress relief and a little physical aging—and the aging all by itself can change how the material resists cracking. Which means you can’t even cleanly say annealing helped because it relieved the stress. Two things changed at the same time. And that, right there, is the whole lesson: a polymer’s response is its entire history, not any single knob you think you turned.
That’s why my answer is never a flat “don’t anneal.” It’s: understand what you’re holding first. If frozen-in tension is driving the cracking, annealing can genuinely help. If a compressive skin is protecting you, annealing can hand that protection away. So fix it at the source where you can—in the processing—and reach for the oven only when you know the story the part is carrying. Because the part remembers how it was born. And if you’re going to rewrite that memory, you’d better know what you’re erasing.
Service and Maintenance Matters
Sometimes the solution isn’t in design or materials—it’s in how the part is used and maintained.
Cleaning protocols: if failures correlate with cleaning, review protocols critically. Can you use a different cleaner (one that doesn’t reduce surface energy)? Reduce cleaning frequency? Rinse with a benign fluid after cleaning to displace the aggressive agent? Avoid wiping high-stress regions?
Education: and yes, I chose that word on purpose, because I’m not a fan of the word training when it comes to people. Over the years I kept running into the same puzzle—so-called trained personnel who simply didn’t follow the process they’d been told, even mandated, to follow. They knew the rule. They ignored it anyway. And I think I finally understand why. At our core, every one of us wants to understand the why. If I believe there’s an easier way to get the job done, I’m going to need a reason to do it differently. So I don’t try to train service personnel—I educate them. I explain the why. When a technician understands why wiping this spot with that solvent can split the part wide open—when they’ve heard the energy story we’ve been telling—they’re far more likely to respect the process. So don’t just say “don’t wipe this area with that solvent.” Tell them why. Educate, don’t train.
Inspection: for critical components, implement inspection for stress whitening or surface crazing. These are early warnings. If you see whitening, investigate before cracks develop.
Part Seven: The Deeper Physics—What Else Is Happening
We’ve focused on surface energy, but there are other effects worth mentioning. EMFC is complex, and surface energy reduction, while the primary mechanism, isn’t the only thing going on.
Effects on Craze Fibrils
Crazes contain polymer fibrils—incredibly fine threads, five to thirty nanometers in diameter, stretched several times their original length, bridging across voids. When fluid replaces air in a craze, it affects the fibrils directly.
Reduced fibril formation energy: creating new fibrils requires generating new fibril surface area. Lower surface energy makes this easier, requiring less stress to form new fibrils during craze widening.
Fibril instability: fibrils are thin cylinders under enormous tensile stress. They’re stable against breakup partly because surface energy resists the increased surface area that would result from fibril breakup. Reduced surface energy reduces this stabilization, making fibrils more prone to necking instabilities and breakup.
Chemical attack: in aggressive fluids—especially those that can cause chain scission—fibrils are particularly vulnerable. They’re highly stressed (stressed bonds break easier), have high surface area (more fluid contact), and contain oriented chains (less entanglement, easier to pull apart). Fluid can attack fibrils directly, causing premature fibril failure.
When enough fibrils fail, the craze transforms into a crack—true empty space. That’s when rapid fracture follows. Surface energy reduction accelerates this craze-to-crack transition through all these pathways.
Molecular Mobility Effects
Fluids that plasticize polymers increase molecular mobility. Higher mobility has multiple effects.
Easier craze formation: mobile chains can rearrange more easily, reducing the stress required to initiate crazes and draw chains into fibrils. Easier shear yielding: more mobility facilitates shear yielding, potentially suppressing crazing in favor of ductile deformation—this is protective, since shear yielding distributes damage and prevents crack localization. Faster stress relaxation: the big protective effect—mobile chains relax stress faster, reducing crack driving force.
The net effect depends on whether damage mechanisms (easier crazing) or protective mechanisms (faster relaxation, possible shear yielding) dominate. This varies with stress level, temperature, exposure time, and material properties.
The Concentration Evolution Effect
When fluid penetrates a crack, its local composition may change over time.
Surfactant adsorption: if the fluid contains surfactants, they may preferentially adsorb to polymer surfaces, depleting the bulk fluid concentration. As concentration drops, surface energy reduction effectiveness may decrease. Selective evaporation: for multi-component fluids (like detergent solutions or solvent mixtures), different components evaporate at different rates. The composition shifts, potentially becoming more or less aggressive. Dilution: water absorption from humidity can dilute organic solvents in cracks, reducing effectiveness. Contamination: polymer degradation products, leached additives, or environmental contaminants can accumulate, changing fluid chemistry.
These effects can reduce EMFC aggressiveness over time in a single continuous exposure—the fluid becomes “spent.” But cyclic exposure with fresh fluid replenishes active components, maintaining high aggressiveness.
Your analogy to crevice corrosion is perfect here. In crevice corrosion, oxygen depletes, pH shifts, and the process becomes self-limiting until fresh electrolyte flushes the crevice. In EMFC, similar self-limiting effects occur, but are defeated by repeated fresh fluid application.
Part Eight: Some Final Thoughts on Thermodynamics and Failure
Let me wrap up with some broader philosophical points about what energy-mediated fluid cracking teaches us.
Thermodynamics Ultimately Governs
Fracture—crack growth, crack formation—is fundamentally a thermodynamic process. It happens when it’s energetically favorable, when the energy released exceeds the energy required.
Griffith understood this a century ago. His energy balance approach transformed fracture mechanics from empirical stress calculations to fundamental thermodynamics.
Energy-mediated fluid cracking is a beautiful illustration of this thermodynamic control. Fluids don’t mechanically weaken polymers. They don’t add stress. They don’t physically push cracks apart. They simply change the accounting—reduce the energy cost per unit crack extension. And that changes everything.
A crack that was thermodynamically stable in air becomes thermodynamically unstable in fluid. Energy balance tips toward crack growth. Failure becomes favorable. And thermodynamics is patient but inexorable—if failure is favorable, it will eventually happen.
Scale Connections Matter
Understanding EMFC requires connecting multiple scales. Molecular: interactions between fluid molecules and polymer chains determine adhesion, work of adhesion, interfacial energy. Nanoscale: craze fibrils are nanometer-scale structures; their formation, stability, and breakdown involve nanoscale processes. Microscale: crazes are microscale features; fluid penetration, void formation, crack tip advance all occur at micrometer scales. Macroscale: component failure is macroscopic—a crack grows to millimeter or centimeter scale, causing structural failure.
You can’t understand the macroscopic failure without understanding what’s happening at every scale below. The molecular interactions determine surface energy. Surface energy governs crack growth at microscale. Microscale crack growth accumulates to macroscopic failure. This is systems thinking. This is holistic engineering. Every scale matters. Every mechanism connects. Understanding one scale in isolation is insufficient—you need to see the whole chain of causation.
Materials Communicate
I always say materials tell their stories. EMFC is a perfect example.
Stress whitening from crazing is the material showing you internal damage. Distributed whitening says “I’m being attacked uniformly.” Localized whitening says “stress is concentrated here.” Progressive whitening over time says “damage is accumulating.” Surface crazing says “stress, check; aggressive fluid, check; EMFC is happening.” Through-cracks say “I reached critical size; energy balance tipped past stability.”
These aren’t just failure modes to document and dismiss. They’re evidence. They’re communication from the material about what happened, what conditions existed, what mechanisms operated. Read the evidence carefully. See what the material is showing you. Let it teach you what went wrong and what to do differently.
The Value of Field Observations
Textbook knowledge is essential—the theory, the frameworks, the fundamental mechanisms. But field observations reveal complexities theory alone might miss.
The wet storage paradox. The swab test versus immersion difference. The cyclic exposure aggressiveness. These came from careful field work, troubleshooting real failures, paying attention to what actually happens rather than what should happen according to simple models.
Don’t discount field observations because they seem to contradict theory. Instead, use them to refine understanding. Ask “why does this happen?” Use theory to explain observations, and use observations to guide theory development. That back-and-forth between theory and practice, between fundamental understanding and real-world complexity—that’s where deep knowledge comes from.
Conclusion: The Story Surface Energy Tells
We’ve covered a lot of ground. From Griffith’s energy balance to surface thermodynamics, from capillary action to stress relaxation, from swab tests to wet storage paradoxes.
Let me distill it to the essentials.
• Energy-mediated fluid cracking happens because fluids reduce surface energy. Reduced surface energy means reduced crack resistance. Cracks that were stable become unstable. Cracks that were growing slowly grow rapidly.
• Which fluids are aggressive depends on molecular interactions. Fluids molecularly similar to the polymer reduce surface energy dramatically. “Like dissolves like” explains specificity. Surfactants are particularly effective because they’re optimized to reduce surface tension and wet surfaces.
• Surface energy reduction demands more crack surface area. When surface energy drops, the existing crack isn’t in energy balance anymore. It must grow—both deeper and longer—to restore equilibrium. Your insight about depth and length is exactly right—it follows directly from thermodynamic balance.
• Cyclic exposure can be more damaging than continuous exposure. Continuous exposure allows protective mechanisms (stress relaxation, equilibration) to engage. Cyclic exposure with fresh fluid prevents equilibration, causing cumulative damage with each cycle. The wet storage paradox illustrates this beautifully.
• Localized application can be more aggressive than immersion. Swab tests deliver concentrated fluid to high-stress locations without time for protective mechanisms. Immersion creates uniform exposure with time for global stress relaxation. Different outcomes from the same fluid.
• Time scales determine outcomes. Fast processes (surface energy reduction, initial crack growth) compete with slower processes (stress relaxation, equilibration). Exposure duration, temperature, and cycling determine which processes dominate and thus whether damage is catastrophic or manageable.
• Testing must match service conditions. Standard immersion tests may not predict cyclic exposure behavior. Localized application tests may reveal vulnerabilities immersion misses. Test as parts will actually be used.
• Design has multiple strategies. Reduce stress. Prevent fluid contact. Choose materials with good stress relaxation. Minimize residual stress. Design for drainage. Seal critical regions. Rethink assembly to eliminate sustained stress.
• Materials tell stories. Stress whitening, crazing patterns, crack locations—all are evidence of conditions and mechanisms. Read the evidence carefully. Let the material teach you what happened.
That’s the surface energy story. That’s how fluids kill polymers. That’s energy-mediated fluid cracking understood through thermodynamics and kinetics, enriched by field observations and practical wisdom.
Understanding EMFC deeply—not just “fluids cause cracks” but why and how and under what conditions—enables intelligent material selection, effective design, meaningful testing, and successful troubleshooting when things go wrong.
Which they will, sometimes. Materials fail. Components crack. Parts break. That’s engineering reality. But with understanding, failures become learning opportunities. Evidence becomes insight. And insight enables prevention.
That’s the journey from failure to wisdom. That’s the path from broken parts to better designs. That’s engineering—understanding deeply, designing thoughtfully, learning continuously.
Thanks for joining me on this deep dive into surface energy, thermodynamics, and the surprising complexity of how fluids affect crack growth. I hope you see energy-mediated fluid cracking differently now—not as mysterious material weakness, but as predictable consequence of energy balances, explainable through physics, preventable through understanding.
Now go look at your components, think about their stress states, consider their fluid exposures, and design with this knowledge. Make things that last. Make things that resist failure even in hostile environments. Make things that work.
That’s the goal. That’s the craft. That’s engineering done right.
And when failures happen—because they will—read what the material is telling you, understand the mechanisms, fix the root cause, and build better next time. That’s the cycle of improvement. That’s how we learn. That’s how engineering progresses.
Listen to the materials. Understand the thermodynamics. Design with wisdom. That’s the holistic way.
Thank you for listening.
This has been Joe McFadden.
Combating engineering mind blindness.
Engineer. Lifelong Learner. Holistic Analyst.
www dot McFadden C A E dot com. McFadden at s net dot net.
Have a thoughtful and wonderful day.
End of audiobook.

The nature of materials.
Teaching Stress and Strain Through Stories: Two Audiobook Essays for My Students
I've been teaching engineering for over twenty years, and one thing I've learned is that formulas don't stick. Stories do.
This semester I tried something different. I took the content from my actual classroom presentations—the demonstrations, the stories, the ways I explain stress and strain to students standing at the whiteboard—and turned them into two audiobook essays. Companion pieces they can listen to outside of class, letting the ideas settle in without the pressure of copying down equations.
The material is all mine. The silly putty demonstration I do every semester. The Saturn story I've been telling for years. The way I explain yielding by asking students to think about what that word actually means. The rod experiment that motivates why we normalize to stress and strain. This is how I teach. It's how I've taught for two decades.
Why audiobooks? Neuroscience shows that when we engage multiple senses, we signal to the brain that the content matters — that this is something important, something worth encoding deeply. Reading engages one pathway. Listening engages another. Doing a demonstration with your hands, another. The more channels, the stronger the signal: pay attention, this matters, remember this.
So I wanted to give students another sensory channel. The same content they hear in class, available in audio form for review. Not replacing the classroom experience, but reinforcing it through a different modality.
I collaborated with two AI systems — Grok from xAI and Claude from Anthropic — to organize my teachings into something that flows as spoken word. But here's what I really want to share, because I think it matters for anyone exploring how to work with AI:
Working with AI can be generative, not passive.
The interaction opens threads. It sends you to new materials, inspires more reading — not mindless consumption. You read a book, then discuss it with AI. Call it a silicon book club. Those conversations lead to new questions, new books, new threads to follow. This year I had to buy a new bookshelf to hold all the books I bought after following threads that started in AI conversations.
That's what learning with AI can look like. Not a shortcut. Not outsourcing your thinking. A thinking partner that expands what you explore, that pushes you into territory you wouldn't have found alone.
If you're an educator, a lifelong learner, someone curious about how AI fits into genuine intellectual work — I'd encourage you to try it. Bring something you know deeply. Talk it through with AI. See where it leads. You might be surprised how much more you end up reading, not less.
Part 1: Feeling the Forces
The first essay, Feeling the Forces: How Materials Carry the Load, covers the fundamentals. Stress as the internal redistribution of external forces. Strain as the proportional response. The constitutive model that ties them together.
But it's built around a story. A colleague shows up with a collection of metal rods—same shape, same dimensions, different materials—and asks: can I hang a mass from one of these? Will it hold? How much will it stretch?
So we poke it. We load it incrementally, record the response, plot the data. A straight line emerges. We test another rod, same geometry, different material—different slope. Same geometry, different response. The difference must be the material itself.
That observation motivates everything that follows. Why we normalize force to stress and elongation to strain. Why the slope of the stress-strain curve is a material property, not a specimen property. What a constitutive model actually is and why it matters.
And here's the insight I wanted students to walk away with: that rod, loaded elastically, is behaving as a spring. Hooke's Law connects the material science to the physics they already know. Every beam, every column, every structural element loaded within its elastic range is fundamentally a spring. The constitutive model lets us separate what belongs to the geometry from what belongs to the material.
Part 2: When Materials Give Way
The second essay, When Materials Give Way, picks up where the first one ends. We'd been talking about elastic behavior—load it, it deforms, unload it, it returns. But what happens when we push too hard?
The material yields.
I wanted students to sit with that word. Yield. It means to give up. To surrender. To stop fighting. We ask the material to carry more and more load, and in the elastic range it resists, it pushes back, it holds the line. But at some point we ask too much, and the material yields. It gives way.
From there, the essay explores how metals and polymers yield through completely different mechanisms. Metals are crystalline—atoms in formation, planes that can slip, dislocations that move like wrinkles in a rug. Polymers are molecular spaghetti—long chains tangled together, sliding past each other when given enough time and thermal energy.
This is where the demonstrations come in—the ones I actually do in class, now captured in a form students can revisit.
I talk about the paperclip. I have students bend one back and forth. Feel it stiffen with each bend as dislocations tangle and pile up. Feel the work hardening happening in your hands. Then feel it break when there's no ductility left. They experience the concept before I name it.
I talk about silly putty. In class, I roll it into a rod, pull it slowly—it flows, the molecules have time to reorient and go with the flow. Roll it back up, pull it fast—it snaps clean. Same material, completely different response. I buy silly putty for all my students to take home. Every time they play with it, they're reinforcing the lesson. Now, when they listen to the audiobook, they can do the demonstration themselves, in their dorm room, with their own putty.
And I tell the Saturn story.
Years ago, Saturn ran TV ads showing shopping carts bouncing off their polymer body panels. No dents. Then they stopped running those ads, and I thought I knew why.
One winter day I was at a gas station with my son when I heard a screech and a bang. A car had struck the side of a Saturn. I went to check on the people—they were fine. But the door panel hadn't dented. It had shattered. Like glass. The cold weather had pushed that polymer past its ductile-to-brittle transition.
I picked up a fragment and put it in my pocket. Showed it to my next class. That piece of shattered door panel taught more about temperature-dependent material behavior than any equation ever could.
Why Audiobooks?
It goes back to that neuroscience insight. The classroom engages certain channels: visual (the whiteboard, the demonstrations), auditory (my voice explaining), kinesthetic (bending the paperclip, pulling the silly putty). When students listen to the audiobook later, they're reinforcing through another exposure, another context, another signal to the brain that this matters.
Students have earbuds in while walking across campus, driving home, doing laundry. The audiobook meets them in those moments — not as a shortcut, but as reinforcement. Same content, different channel, deeper encoding.
And there's something about the spoken word that invites a different kind of attention. You can't skim audio. You have to let it unfold at its own pace. That slower engagement gives ideas time to take root.
The Bigger Picture
There's a shift happening — students becoming passengers rather than drivers in their relationship with technology. These audiobooks are part of my response to that.
But they're also a demonstration of something I hope others will explore: AI as a partner, not a replacement. The AI didn't know about silly putty demonstrations or shattered Saturn doors. It couldn't. That knowledge comes from twenty years in the classroom. What AI could do was help organize that knowledge, structure it, shape it into a new form. That's the partnership model that makes both parties more capable.
The goal isn't to make things easier. It's to make things stick. To build mental models that let students reason about problems before they reach for formulas. To give them physical artifacts — silly putty, a shattered door panel, the memory of bending a paperclip — that anchor abstract concepts in lived experience.
When a student can close their eyes and see dislocations gliding through a crystal lattice, or chains sliding past each other in a polymer melt, or a rod behaving as a spring under load — that's when they own the material. That's when they become engineers, not just people who can plug numbers into software.
The formulas matter. But the seeing comes first.
Both audiobook essays are available to my students through our course materials. If you're an educator interested in this approach, feel free to reach out.
Link to my Drop Box Below
When Materials Show Their Stress
Link to Audiobook Part 1- > https://www.dropbox.com/scl/fi/975j05yq21ui9fmccz80o/Part_1_Stress_Whitening_McFadden_24Feb2026.mp3?rlkey=1cnqict049tvo8trzczntblv2&st=x4sr19za&dl=0
Link to Audiobook Part 2 → https://www.dropbox.com/scl/fi/tcfnikqjsdxuggyb3av0w/Part_2_Stress_Whitening_McFadden_23Feb2026.mp3?rlkey=hamkijkc7z74wvqocxffsmqf1&st=kmx06xd7&dl=0
A Conversation
Stress Whitening in Polymers
A Two-Part Essay
By
Joseph P. McFadden Sr.
Engineer, Lifelong Learner, Holistic Analyst
Combating Engineering Mind Blindness, One Student at a Time
In Collaboration with Claude
by Anthropic
mcfadden@snet.net
www.mcfaddencae.com
PART ONE
Foreword
Hello, my name is Joe McFadden. I’ve spent more than forty-five years as an engineer, educator, and investigator of failures. I’m offering this content to you, not as a textbook, but as a conversation—with failure itself, with history, and with lived experiences.
Based upon my experiences I found that many failures, across many industries, were the result of the failure to incorporate a holistic approach during development.
This brings me to today’s discussion of Stress Whitening.
Introduction: The Visible Signature of Damage
You know what I love about polymers? They tell on themselves. You stress them, they show you. Bend a clear plastic ruler hard enough, and it suddenly goes white at the bend. Drop a plastic bucket, and you get this pale, cloudy mark where it hit the ground. Flex a polypropylene living hinge enough times, and it develops this chalky appearance along the fold line.
That’s stress whitening. And it’s beautiful, in a way, because it’s the material showing you—visually, obviously, right there for anyone to see—that something has changed inside. Damage has accumulated. Structure has been altered. The material is telling its story, if you’re willing to listen.
Now, most people see stress whitening as a cosmetic defect. “Oh no, my plastic part turned white, it looks terrible.” And sure, aesthetically it might not be ideal. But as an engineer, as someone who wants to understand what’s happening inside materials, stress whitening is a gift. It’s a window into internal processes that would otherwise be invisible.
So let’s talk about stress whitening. We’re going to explore what causes it—and there are multiple mechanisms, not just one. We’re going to understand why it matters, how to measure it, how different polymers behave, and what it tells us about the material’s internal state.
By the end of this conversation, you’re going to look at whitened plastic differently. You won’t just see a defect. You’ll see evidence. You’ll see a material telling you its story. And you’ll be able to read that story and understand what happened.
Part One: Why Things Look White — The Physics of Light Scattering
Before we can understand stress whitening, we need to understand something more fundamental: why do things look white in the first place? Why is snow white? Why is milk white? Why does paper appear white?
So let’s start with the story of light scattering.
It all comes down to light scattering. Let me paint you a picture.
Imagine light as a stream of photons traveling in a straight line through a material. If the material is perfectly uniform—same refractive index everywhere, no interfaces, no particles, no density variations—the light just keeps going straight. It passes through undisturbed. That’s transparency. That’s why clean water or clear glass or pristine acrylic looks transparent. Nothing deflects the light, so it goes straight through, and you can see through the material.
Now imagine the same material, but with tiny particles suspended in it. Or little bubbles of air. Or regions of different density. Suddenly, the light encounters interfaces—boundaries between regions with different refractive indices. At each interface, some light reflects, some refracts, changing direction.
If you’ve got one interface, you get a reflection—like seeing yourself in a window. But if you’ve got thousands or millions of tiny interfaces randomly oriented and randomly positioned throughout the material, something different happens. Light bounces around chaotically. It scatters in all directions. Some of it comes back out of the surface in random directions, and that’s what your eye sees as white.
Think about snow. Ice is transparent—you can see through a clear ice cube. But snow is white. Why? Because snow is millions of tiny ice crystals with air spaces between them. Light enters the snow, encounters ice-air interfaces everywhere, bounces around chaotically, and emerges in random directions. End result is you see white.
Milk? Same thing. Milk is water with fat droplets and protein particles suspended in it. Those droplets and particles scatter light. Again, you see milk as being white.
Paper? Cellulose fibers with air spaces between them. Light scattering. You guessed it, again you see white.
The Key Ingredient: Refractive Index Contrast
The stronger the difference in refractive index at those interfaces, the more light scatters. Air has a refractive index around 1.0. Most polymers have refractive indices around 1.5. That’s a big difference—about 50%. So an air void in polymer creates strong scattering.
Density variations within the polymer itself create much smaller refractive index differences—maybe 1% or 2%. Those scatter light too, but much more weakly. You need lots of them to produce visible whitening.
This is why stress whitening happens. When you stress a polymer, you create structures that scatter light—voids, crazes, density variations, oriented regions. The material that was transparent or uniformly colored becomes cloudy, milky, white. You’ve created light-scattering centers that weren’t there before.
The material is showing you, visually, that its internal structure has changed.
Part Two: The Many Faces of Stress Whitening
Now here’s where it gets interesting. Stress whitening isn’t one phenomenon. It’s not like there’s a single mechanism called “stress whitening” that happens the same way in every material. No—there are multiple different ways to create light scattering in stressed polymers, and which one dominates depends on the material, the loading, the temperature, the stress state.
Let me walk you through the major mechanisms. Think of these as different stories the material can tell, different ways it can respond to stress and show you that response visually.
Story One: Crazing — The Void Network
The most common mechanism, especially in glassy polymers like polystyrene or PMMA, is crazing. We talked extensively about crazing in our last conversation, but let’s revisit it from the stress whitening perspective. For detailed discussions on both crazing and shear yielding, go to my blog for access. My blog is listed at the end of this essay.
A craze is that remarkable structure—looks like a crack, but it’s not empty. It’s a network of incredibly fine polymer fibrils, maybe 5 to 30 nanometers in diameter, bridging across the craze from one side to the other. And between those fibrils? Voids. Empty space. Air.
The craze structure is about 50% void, 50% highly stretched polymer fibrils. And that void content is what creates the whitening. Think about the refractive index contrast: polymer at index n = 1.5, air at n = 1.0. Maximum possible contrast. Those voids scatter light intensely.
When you look at a crazed polymer, you’re seeing light scattering off thousands of tiny air-polymer interfaces in that craze structure. The craze appears white, bright, silvery. Sometimes almost iridescent if the void spacing happens to be just right to create interference effects.
Multiple crazes make it worse. Polystyrene under tension can develop dozens of parallel crazes, each one a plane of intense light scattering. The material goes from transparent to completely opaque, pure white, because light can’t penetrate through all those scattering layers.
The thing about craze whitening is it’s very localized and very oriented. Crazes form perpendicular to the tensile stress, so they’re planar features. If you look at a crazed specimen, you can often see individual crazes as distinct white lines. The whitening tells you exactly where the tensile stress was highest—it’s mapping the stress field for you, visually.
Story Two: Shear Yielding — The Subtle Whitening
When polymers shear yield instead of crazing, they can still whiten, but the character is different. This whitening is more subtle, more diffuse, less dramatic than craze whitening.
So, what’s happening? Several things, actually.
First, molecular chains are orienting during plastic flow. When chains line up in the stress direction, they create refractive index anisotropy—different refractive index parallel to the chains versus perpendicular. If this orientation varies spatially—more oriented here, less oriented there—you get refractive index gradients. Those gradients scatter light.
Second, free volume is redistributing. During shear yielding, those nanoscale voids between molecular chains migrate and concentrate. This creates density fluctuations. Small refractive index changes, maybe only 1% or 2%, but over large volumes. Collectively, they scatter enough light to create visible whitening.
Third, some polymers form nanovoids during shear yielding—tiny voids, much smaller than the macroscopic voids in crazes, but present in enormous numbers. Each one scatters a little light; millions of them create visible whitening.
The result is that shear-yielded regions appear whitened, but it’s a different look. More chalky, more uniform, more diffuse. Not the sharp silvery lines of crazes. More like the material has been stressed into a slightly cloudy, milky state.
And here’s an important point: shear yielding whitening tells you the material deformed ductilely. It stretched, it flowed, it absorbed energy. That’s good for toughness. Craze whitening often means brittle behavior. So the character of whitening tells you something about how the material failed.
Story Three: Rubber Particles — The Engineered Whitening
Now we get to one of my favorite mechanisms because it’s deliberately designed into the material. Rubber-toughened polymers like HIPS or ABS contain dispersed rubber particles—typically 0.1 to 10 micrometers in diameter—distributed throughout the glassy matrix.
When you stress these materials, something clever happens. Those soft rubber particles create stress concentrations because there’s a huge modulus mismatch between the rubber (super soft, maybe E = 5 MPa) and the glassy matrix (stiff, E = 3000 MPa). At relatively modest applied stress—maybe 50% or 60% of yield—those stress concentrations cause the rubber particles to cavitate. They form voids internally, or the particle-matrix interface debonds, creating voids around particles.
Suddenly you’ve transformed millions of nearly-transparent rubber particles into millions of light-scattering voids. The material whitens dramatically. And this happens before the material yields, before any significant deformation.
Now here’s the brilliant part: this whitening is part of the toughening mechanism. By cavitating, those rubber particles relieve hydrostatic tension locally. They shift the local stress state away from conditions that would promote matrix crazing and toward conditions that promote matrix shear yielding. The material gets tougher because of this cavitation.
So in rubber-toughened polymers, stress whitening is a good sign. It means the toughening mechanism has activated. The material is doing what it was designed to do. You see uniform whitening throughout the stressed region—looks almost like someone painted it with diluted white paint—and the material is busy absorbing energy and resisting fracture.
The intensity of whitening actually correlates with toughness. More rubber particles, more whitening, more impact resistance. Materials scientists designing impact-resistant polymers use stress whitening intensity as a metric during development.
Story Four: Interfaces That Fail
In filled polymers—materials containing glass fibers, mineral fillers, pigment particles—stress whitening can come from interfacial debonding. The bond between particle and matrix fails, creating a void between them.
This is damage. Real damage. Not a toughening mechanism like rubber particle cavitation—actual degradation. Those debonded interfaces represent lost load transfer, reduced stiffness, reduced strength.
The whitening from interfacial debonding tells you either the interface was weak (poor adhesion, inadequate coupling agent, contaminated surfaces) or the stress exceeded what the interface could handle.
When you see this whitening pattern, it often follows the filler distribution. In glass fiber composites, whitening appears along fiber directions where fibers are debonding. In mineral-filled parts, whitening intensity relates to filler concentration.
This is diagnostic information. Unexpected whitening in a filled polymer? Check your coupling agent. Check your mixing process. Check surface treatments. The material is telling you the interfaces are failing.
Story Five: The Crystalline Complications
Semicrystalline polymers like polyethylene or polypropylene have their own special whitening mechanisms related to their crystalline structure. These materials already contain inherent structure—crystalline regions (ordered, dense) distributed in amorphous regions (disordered, less dense). This creates some natural opacity to begin with.
When you stress them, several things can happen. Crystalline lamellae can fragment—break into smaller pieces. Those smaller fragments scatter light more than the original larger ones. Voids can form between crystallites. The crystallites themselves can reorient, changing the spatial distribution of scattering centers.
The result is that semicrystalline polymers can show stress whitening, but it’s got a different character than glassy polymers. Often more gradual, more diffuse, sometimes partially reversible if you heat the material because crystallites can reorganize.
Polyethylene is famous for this. Bend a milk jug—the classic HDPE example—and you get whitening along the bend. But it’s not sharp craze lines. It’s a diffuse, cloudy region. That’s a combination of void formation between lamellae and crystallite fragmentation.
Story Six: When Environment Accelerates Everything
And then there’s environmental stress cracking—ESC. When a chemical agent contacts a stressed polymer, it can dramatically accelerate whitening. The chemical makes crazing easier by reducing surface energy, plasticizing the surface, penetrating into crazes and promoting their growth.
I have a separate discussion on ESC, which I renamed based upon the physics behind the condition. In those essays I talk about why I think we need a new name—Energy-Mediated Fluid Cracking, or EMFC for short—and why the old name actually obscures what’s really happening. For now, I will use ESC for this essay.
ESC whitening appears much faster than mechanical whitening alone. You might have a part under moderate stress for months with no whitening, then it contacts a cleaning solvent, and boom—whitening appears within hours.
This whitening is a warning. It’s telling you ESC is happening, and if it continues, cracking will follow. The whitening gives you a chance to intervene—remove the chemical, reduce the stress, replace the part—before catastrophic failure.
Part Three: Reading the Evidence — What Whitening Tells You
So we’ve got multiple mechanisms, different appearances, different implications. How do you read the evidence? How do you look at a whitened polymer and understand what’s happening inside?
The Character of Whitening
Sharp versus Diffuse
If you see sharp, well-defined white lines or bands, you’re probably looking at crazes. Those are planar features, so they create sharp boundaries. Grab a magnifier and look closely—you might resolve individual craze lines.
If the whitening is diffuse, fuzzy, spread over a region without sharp boundaries, you’re probably looking at shear yielding or rubber particle cavitation or some distributed mechanism. The light scattering is coming from many small features distributed throughout a volume, not from distinct planes.
Silvery versus Chalky
Craze whitening often has a silvery, almost metallic appearance. Sometimes iridescent. That’s because the void structure in crazes can have some regularity—the fibril spacing creates periodic interfaces that can produce interference effects.
Shear yielding whitening looks more chalky, more matte. Like the material’s been dusted with talcum powder. No iridescence, no silvery quality. Just a flat, milky appearance.
Early versus Late
When did the whitening appear? If it showed up at low stress, before any yielding or significant deformation, you’re probably seeing rubber particle cavitation. That’s designed to happen early.
If whitening appeared only after significant deformation, you’re seeing mechanisms associated with plastic flow—shear yielding or extensive crazing developed after yield.
If whitening appeared suddenly at high stress just before fracture, you’re seeing damage localization. The material concentrated stress into a small region, damaged it intensely, then failed.
Pattern and Location
Where does whitening occur?
Whitening concentrated at sharp corners, notches, or holes? That’s telling you about stress concentrations. The geometry created high stress there, initiating whatever whitening mechanism your material is prone to.
Uniform whitening throughout a stressed region? That suggests a distributed mechanism like rubber particle cavitation, or uniform stress fields causing uniform crazing or shear yielding.
Whitening along specific lines or directions? Could be weld lines (molecular orientation effects), fiber directions (interfacial debonding along fibers), or flow patterns from processing.
Orientation
Craze whitening is perpendicular to tensile stress. So the orientation of white lines tells you the stress direction. See parallel white lines? They’re perpendicular to the tensile stress that created them.
Shear band whitening is typically at about 45° to the tensile axis—that’s where shear stress is maximum. So if you see diagonal bands of whitening in a tension specimen, those are probably shear bands.
Intensity and Progression
How white is it?
Slight whitening—barely visible, just a faint cloudiness? That’s early-stage damage. Maybe initial particle cavitation, or the beginning of crazing, or modest molecular orientation effects.
Intense whitening—completely opaque, pure white? That’s advanced damage. Extensive void networks, multiple crazes, high concentration of cavitated particles.
Is it getting worse? If whitening is progressive—appearing gradually under sustained load or increasing with cycles—you’re watching damage accumulation in real time. Fatigue loading often shows this. Each cycle adds a little more damage, a little more whitening, until eventually something fails.
If whitening appeared suddenly and hasn’t changed, it might be from a single overload event. The stress spiked once, created damage, then normal operating stress isn’t high enough to propagate it further.
Thank you for reading Part One of this two-part essay on stress whitening. In Part Two, I will go into more detail regarding individual types of plastics.
PART TWO
In Part One of this two-part essay on stress whitening, I discussed the why behind stress whitening—going into depth regarding the underlying physics behind this phenomenon we call stress whitening.
As you will come to know about me, I look to understand the nature of materials by observing how they respond to our poking. They have a story, and to understand that story we first need to understand their nature.
Part Four: Material Personalities — How Different Polymers Whiten
Different polymers have different personalities, different ways of responding to stress, different whitening behaviors. Let’s meet some of them.
Polystyrene: The Craze Specialist
Polystyrene (PS) is the poster child for craze whitening. Pure PS crazes at the drop of a hat. Low molecular weight, minimal chain entanglement, not much to prevent craze formation. Stress it in tension, and you get beautiful, well-defined crazes, each one appearing as a sharp white line.
The material goes from transparent to completely white with relatively little deformation. It’s brittle. The whitening appears, intensifies, and shortly thereafter the material cracks. Not much warning between “it whitened” and “it failed.”
This is why pure PS isn’t used for structural applications. It’s great for applications where you don’t stress it much—disposable cups, CD cases, foam packaging. But load it mechanically? It crazes, whitens, breaks. A brittle response.
Now, add rubber particles—make it HIPS (High Impact Polystyrene)—and the story changes completely. Still whitens, but now it’s from rubber particle cavitation plus some matrix shear yielding. The material is tough. It can whiten intensely and still sustain large deformations before failure. The whitening character is different—more uniform, more diffuse. And the whitening is actually a good sign. It means the toughening mechanism is working.
PMMA: The Clearer Cousin
Polymethyl methacrylate—plexiglass, acrylic—also crazes, but not quite as readily as PS. Higher molecular weight, better chain entanglement, a bit more resistance to craze formation.
You still get craze whitening, but the crazes are fewer, larger, better defined. The material maintains transparency longer under stress. When crazes finally form, they’re quite visible—sharp white bands across the otherwise clear material.
PMMA’s higher molecular weight also means better craze fibril strength. The material can sustain larger crazes before they convert to cracks. So you get more warning—whitening appears, persists, might even grow slowly, before final failure.
This makes PMMA more suitable for stressed applications than PS. Aircraft windscreens, safety shields, aquarium walls—these use PMMA because even though it can craze and whiten, there’s a margin between whitening and failure. You get warning.
Polycarbonate: The Tough Ductile One
Polycarbonate (PC) is interesting because it sits on the boundary. It can craze, especially near notches or at high stress concentrations where triaxial tension develops. But it also shear yields readily because of its chain flexibility and high molecular weight.
So PC can show both types of whitening, sometimes in the same specimen. Near notches? Sharp craze whitening. Away from stress concentrations, in regions of lower constraint? Diffuse shear yielding whitening.
And PC can sustain enormous strains—100%, 150%, even more—before breaking. So you can have a heavily whitened PC specimen that’s still intact, still functional. The whitening indicates damage, yes, but PC is tough enough to keep going.
This is why PC is used for impact-critical applications—safety helmets, machine guards, bullet-resistant glazing. It whitens under impact, showing you it absorbed energy, but it doesn’t catastrophically fail. The whitening is evidence of the material doing its job.
Polyethylene (PE): The Tough Semicrystalline Polymer
PE has its own character. It’s semicrystalline, already somewhat opaque in its natural state due to crystalline structure. When you stress it, whitening comes from voids forming between lamellae, crystallite fragmentation, maybe some chain pullout at low molecular weights.
The whitening is diffuse, gradual, increases with strain. PE can sustain huge strains—300%, 400%, sometimes more—before breaking. Whitening appears early and progressively increases as you deform it, but the material keeps stretching and stretching.
Bend a PE milk jug, you get a whitened crease. But that jug is still holding milk just fine. The whitening shows the material deformed plastically, but PE is tough enough that plastic deformation doesn’t mean failure.
Interestingly, PE whitening can be partially reversible. Heat it back toward the melting point, and some of the whitening disappears as voids heal and crystallites reorganize. This isn’t true for craze whitening in glassy polymers—once you’ve created those void structures, they’re permanent unless you melt and resolidify.
Rubber-Toughened Polymers: The Designed Whiteners
ABS, HIPS, toughened nylon, rubber-modified PC—these are designed to whiten. The rubber particles are there specifically to cavitate, and cavitation creates whitening.
So when these materials whiten, it’s not necessarily a problem. It’s the material working as designed. The whitening indicates energy absorption, damage distribution, successful toughening.
Of course, aesthetics might be a problem. A black ABS automotive part that develops white stress marks doesn’t look great. But mechanically, the part is doing exactly what it was designed to do. The whitening is the visible signature of toughening.
This creates an interesting design tension: you want toughness (which comes with whitening), but you also want appearance (which whitening degrades). Material scientists and product designers balance these competing requirements by choosing rubber particle types and concentrations, selecting colors and surface finishes that hide or minimize visible whitening, and designing geometries that minimize stress levels to delay whitening onset.
Part Five: Measuring the Whitening
If stress whitening is important—for quality control, for material characterization, for design validation—you need to measure it. How do you quantify whitening?
The Simple Way: Your Eyes
The most basic measurement is visual observation. Look at it. Is it white? How white?
You can develop rating scales: None, Slight, Moderate, Severe. Define what each rating means, show examples, train people to rate consistently. For production quality control, this is often sufficient. Fast, no equipment required, works on any part geometry.
The limitation, of course, is subjectivity. What one person calls “moderate,” another might call “slight.” But with training and standardized examples, visual rating can be reasonably consistent and useful.
The Instrumental Way: Measure the Light
For quantitative measurements, you need instruments. Several approaches exist:
Transmission Measurement
For transparent materials, measure how much light passes through before and after stressing. Whitening reduces transmission because light scatters instead of passing straight through.
Set up a light source on one side of the specimen, a photodetector on the other. Measure transmitted intensity. As whitening increases, transmission decreases. Plot transmission versus strain or stress, and you get a quantitative whitening curve.
This works great for transparent polymers. But opaque materials? Can’t measure transmission through something you can’t see through. Need a different approach.
Reflectance Measurement
Shine light onto the surface, measure how much reflects back. Whitened surfaces reflect more diffuse light—they look brighter, lighter.
Color measurement instruments (spectrophotometers) can measure this quantitatively, giving you values like L* (lightness) in the CIE color space. L* goes from 0 (black) to 100 (white). As stress whitening increases, L* increases.
This works on any surface, transparent or opaque. And it’s relevant for aesthetic evaluation since what we care about visually is the reflected light anyway.
Gloss Measurement
Another approach measures gloss—the shininess of the surface. Whitening often reduces gloss because the surface becomes matte from subsurface scattering.
Gloss meters are common in industry—paint shops, plastic molders, coating companies all use them. Quick, simple measurement. Gloss decrease can indicate whitening, though it’s also sensitive to surface roughness independent of bulk whitening.
The Microscopic Way: Look Closer
For understanding mechanisms, microscopy is invaluable. You can’t just know “it’s white”—you want to know why it’s white. What structures are scattering the light?
Optical microscopy with decent magnification can resolve individual crazes, see cavitated rubber particles, observe shear bands. Take a whitened specimen, put it under the microscope, and the mechanisms often become obvious.
For even finer detail, electron microscopy reveals the internal structure of crazes, the morphology of cavitated particles, the void distributions. This is research-level characterization, not routine quality control, but it builds the understanding that lets you interpret simpler measurements.
The Advanced Way: X-ray Scattering
For research applications, small-angle X-ray scattering (SAXS) can quantify void size distributions and volume fractions. You can measure voids too small to see with microscopy, get statistical distributions over large volumes, track void evolution during deformation.
This is specialized equipment, not widely available, but it provides the most detailed quantitative information about the void structures creating whitening.
Part Six: Why It Matters — Practical Implications
Okay, so stress whitening happens, we understand the mechanisms, we can measure it. But so what? Why does this matter practically?
For Product Design
Aesthetic Considerations
In consumer products where appearance matters, stress whitening is often unacceptable. Nobody wants their clear phone case to turn white from normal handling. Nobody wants white stress marks on their appliance housing.
So you design to prevent it. Material selection is first: choose materials that don’t whiten readily, or choose opaque dark colors that hide whitening. Geometry matters too: avoid stress concentrations, keep stress levels low, use generous radii.
Sometimes you can’t avoid whitening mechanically, so you use cosmetic solutions. Surface coatings that don’t whiten. Painted or plated finishes. Multi-layer structures where a non-whitening outer layer hides a whitening structural layer.
Functional Uses
But sometimes whitening is useful. Overload indicators use stress whitening deliberately—design the part so it whitens if stressed beyond design levels. Inspection shows if the part experienced overload even if it’s still functional.
Assembly indicators work similarly—design a snap-fit that whitens slightly when fully engaged. Visual confirmation of proper assembly.
Tamper-evident seals use stress-whitening materials. Opening the seal causes permanent whitening, making tampering obvious.
For Manufacturing
Process Monitoring
Whitening during or immediately after molding indicates problems. Excessive residual stress from improper cooling. Too much packing pressure. Ejection forces too high. The part is telling you the process created high stress.
Solution: optimize the molding cycle. Reduce packing pressure, extend cooling time, improve ejection system design, reduce mold temperature gradients.
Quality Control
Inspect parts for unexpected whitening. If parts show whitening fresh from the mold or after assembly, something’s wrong. Either the material is weak (degraded, contaminated, wrong grade), or the process is creating excessive stress, or the design has stress concentrations.
Whitening is a red flag: investigate and fix the root cause.
For Service and Reliability
Damage Monitoring
On parts in service, whitening indicates damage accumulation. An inspection program can track whitening progression, using it as a damage metric. If whitening increases over time, the part is experiencing ongoing damage. Plan replacement before failure occurs.
This is especially valuable for fatigue-critical components. Progressive whitening under cyclic loading warns that fatigue damage is accumulating. The whitening gives you lead time—you see it developing and can take action.
Failure Analysis
When parts fail, examine whitening patterns. Where was it? How intense? What character?
Whitening localized at the fracture origin indicates the damage accumulated there first. That’s where stress was highest, where mechanisms initiated, where failure nucleated.
The whitening pattern reveals stress distribution. It’s like the material highlighted the high-stress regions for you. See where it whitened, and you understand where stress concentrated.
The whitening mechanism tells you failure mode. Sharp craze whitening? Brittle failure. Diffuse shear whitening? Ductile failure after extensive deformation. Uniform particle cavitation whitening? Toughening mechanism activated, failure occurred despite that.
This diagnostic information guides redesign. If whitening shows stress concentrated at a sharp corner, you know to add a radius. If whitening appeared throughout after environmental exposure, you suspect ESC and change materials or eliminate chemical contact.
Part Seven: Environmental Effects — When Chemistry Accelerates Whitening
We need to talk specifically about environmental stress cracking and how it affects whitening, because this is one of the most important practical issues involving stress whitening.
The ESC Whitening Story
Picture this: you’ve got a plastic part under moderate stress. It’s been in service for months, maybe years, with no whitening, no problems. Then it contacts some chemical—a cleaning solvent, a hydraulic fluid, a food ingredient—something that wouldn’t dissolve the plastic or even noticeably affect it if there were no stress.
And suddenly, within hours or days, whitening appears. Rapidly intensifying. Then cracks follow. Catastrophic failure.
That’s environmental stress cracking with accelerated whitening. The chemical isn’t causing the damage directly—the stress is doing that. But the chemical is dramatically accelerating the damage mechanisms.
How It Works
The chemical does several things. It reduces surface energy, making it easier to create voids—crazes form at lower stress. It provides slight surface plasticization, increasing molecular mobility just enough to accelerate craze fibril formation and growth. It wicks into developing crazes by capillary action, concentrating at crack tips where it does maximum damage.
And once inside the craze, it attacks the highly stressed fibrils. Those fibrils are under enormous tension, stretched several times their original length. They’re vulnerable. The chemical causes premature fibril breakdown—chains break, entanglements pull out, fibrils fail.
When enough fibrils fail, the craze becomes a crack. And then rapid fracture follows.
The Whitening Warning
Here’s the key point: the whitening appears before the crack. There’s a window—sometimes hours, sometimes days—where whitening is visible but the part hasn’t failed yet.
That whitening is your warning. It’s the material telling you: “ESC is happening. I’m accumulating damage. If this continues, I will fail.”
That warning gives you opportunity to intervene. Remove the chemical exposure. Reduce the stress. Replace the part. Do something, because the clock is ticking.
Industries that have experienced ESC failures—and that’s a lot of industries—learn to watch for stress whitening. Inspection protocols specifically look for whitening in chemically exposed regions. Appearance of whitening triggers action.
Case Example: The Polyethylene Tank Story
Let me tell you about polyethylene storage tanks. PE is commonly used for chemical storage—it’s resistant to many chemicals, tough, doesn’t rust like metal tanks.
But PE is susceptible to ESC from certain organic chemicals, particularly surfactants and oils. The classic failure mode is stress cracking at the tank bottom where residual stress from fabrication or hoop stress from weight of contents meets chemical exposure.
Tanks that had been in service for years would suddenly develop whitening at the bottom, in the corners, where stress and chemical exposure coincided. Then cracks would appear. Then leaks. Then catastrophic failure, sometimes dumping thousands of gallons of contents.
Once the mechanism was understood—ESC with whitening as the warning sign—inspection programs changed. Regular inspection for whitening. If whitening appears, replace the tank before it cracks. The whitening became a predictive maintenance indicator.
Lives saved, environmental damage prevented, money saved—all because people learned to read the whitening as a warning message from the material.
Part Eight: Special Cases and Curious Phenomena
Before we wrap up, I want to share some interesting special cases and unusual whitening phenomena that illustrate just how rich and complex this behavior can be.
The Reversible Whitening
Most stress whitening is permanent. Once you’ve created voids, crazes, structural changes, they persist even if you remove the stress. The material stays white.
But some whitening is partially reversible, particularly in semicrystalline polymers. Heat a whitened polyethylene part near its melting temperature, and some of the whiteness disappears. The voids heal, the crystallites reorganize, density increases again, light scattering decreases.
This isn’t true healing—the plastic deformation is permanent, the material has been stretched or compressed—but the optical signature can fade. Heat treatment can restore appearance even though mechanical properties don’t fully recover.
This creates interesting possibilities. Parts that whiten in service might be “rejuvenated” by heat treatment, recovering appearance. Of course, you’d have to understand why they whitened in the first place and whether heat treatment introduces new problems (such as dimensional changes or property degradation).
The Stress-Whitening/Stress-Relaxation Competition
Here’s a curious phenomenon: time-dependent behavior can affect whitening. If you load a viscoelastic polymer and hold it at constant strain, stress gradually relaxes. As stress decreases, the driving force for further whitening decreases.
So you can get situations where initial loading causes some whitening, but further whitening slows or stops even though the strain remains constant. The material has relaxed the stress below the threshold for continued damage.
Conversely, creep loading—constant stress, increasing strain—can produce progressive whitening as strain accumulates and damage mechanisms activate at higher strains.
This means loading history matters for whitening, not just peak stress or strain. Two specimens at the same final strain can show different whitening if one was loaded fast (high peak stress, more whitening) versus slowly (lower peak stress, stress relaxation, less whitening).
The Self-Healing Whitening (Sort Of)
There’s some fascinating research on polymers that can heal damage, including some of the damage that causes whitening. Self-healing polymers containing embedded microcapsules of healing agents, or polymers with reversible bonds that can recombine after breaking.
If the mechanism creating whitening involves broken bonds that can re-form—say, interfacial debonding that can re-heal, or nanovoids that can close and reconnect—then healing is possible.
This is cutting-edge research, not yet common commercial reality, but it points to a future where stress whitening might not be permanent. The material could tell you it was damaged (it whitened), but then, given time and proper conditions, heal itself and recover both mechanical properties and appearance.
The Whitening That Predicts Failure Location
In fatigue testing, stress whitening often localizes before the final fracture. You’ll see diffuse whitening distributed throughout a cyclically loaded specimen, but then one region suddenly whitens more intensely. That’s where damage is localizing, where strain is concentrating, where the crack will ultimately form.
Experienced test engineers watch for this. The moment whitening localizes, they know: that’s the failure location. Sometimes they can even call it before the crack visibly appears. The whitening precedes the crack by a small margin, giving warning.
This predictive capability exists in service too. Progressive whitening that becomes non-uniform, developing a localized intense region, warns that failure is imminent at that location.
Part Nine: What This All Means — The Big Picture
We’ve covered a lot—mechanisms, measurements, materials, applications. Let me step back and talk about what stress whitening teaches us more broadly about materials and engineering.
Materials Are Communicative
Stress whitening is one of many ways materials communicate their internal state. Metals show slip lines, yield points, work hardening. Ceramics show microcracking. Composites show matrix cracking and fiber breakage. And polymers show stress whitening.
Each material class has its own language, its own way of showing you what’s happening inside. Learning these languages—becoming fluent in reading material behavior—is part of becoming an effective engineer.
When you see stress whitening, you’re not just seeing a cosmetic defect. You’re seeing evidence of internal structural changes. You’re seeing the material’s stress history written visually on its surface. You’re seeing warnings of potential failure, or confirmation that mechanisms are operating as designed.
That’s valuable information if you know how to read it.
The Multi-Scale Nature of Material Behavior
Stress whitening beautifully illustrates how material behavior spans scales. At the molecular level, we have chains rearranging, orienting, disentangling. At the nanoscale, we have voids forming, density fluctuating. At the microscale, we have crazes developing, particles cavitating. At the macroscale, we see whitening—light scattering creating visible appearance change.
Understanding stress whitening requires connecting all these scales. You need to know what’s happening molecularly to understand how nano- and microscale structures form. You need to understand those structures to predict optical scattering. And you need optical understanding to interpret what you see.
This is systems thinking. This is holistic materials science. You can’t understand the macroscopic phenomenon by looking at just one scale. You need to see the connections, the relationships, how molecular events cascade up through scales to create observable behavior.
Design Is About Understanding Trade-Offs
Stress whitening often represents a trade-off. High toughness materials frequently whiten because toughening mechanisms involve void formation or distributed damage. Materials that don’t whiten are often more brittle.
You can’t always have everything. You might have to choose: do you want impact resistance (with whitening) or appearance retention (with brittleness)? Do you want visible damage indicators (whitening shows stress) or aesthetic perfection (no whitening allowed)?
Understanding the mechanisms lets you make informed choices. If toughness matters more than appearance, select rubber-toughened materials and design for function despite whitening. If appearance is critical, select materials that don’t whiten and design to minimize stress.
There’s no universal “best” answer. There’s only understanding the trade-offs and choosing appropriately for your application.
Failure Analysis Is Detective Work
When you investigate failures involving stress whitening, you’re doing detective work. The whitening is evidence—physical traces of what happened, markers showing stress distribution, indicators of which mechanisms operated, warnings of progression toward failure.
Like any detective, you need to read the evidence carefully. What does the pattern tell you? What does the intensity indicate? What does the character reveal about mechanism? What does the location show about stress distribution?
And like good detectives, you can’t jump to conclusions. You need multiple pieces of evidence. Whitening alone doesn’t tell the whole story. Combine it with fracture surface examination, stress analysis, material characterization, service history. Build a complete picture.
The material left you clues. Read them carefully, interpret them correctly, and they’ll tell you what happened and why.
Conclusion: Seeing What the Material Shows You
We started by talking about how polymers “tell on themselves”—they show stress damage visually through whitening. Now you understand what they’re showing you and what it means.
When you see a clear plastic ruler go white where you bent it, you’re seeing crazes—thousands of tiny voids in fibrillar networks, scattering light that would otherwise pass straight through.
When you see a polyethylene bucket develop a chalky appearance where you flexed it, you’re seeing voids between crystallites, chain orientation effects, molecular-scale structural changes manifesting as visible whiteness.
When you see an ABS part develop uniform white stress marks in a bend, you’re seeing rubber particles cavitating deliberately, activating the toughening mechanism that makes ABS impact-resistant.
Each of these is the material talking to you. Showing you its internal state. Warning you of damage, or confirming it’s functioning as designed, or revealing its stress history.
The question is: are you listening? Are you seeing what the material is showing you?
Most people see stress whitening as a simple defect: “The part turned white. Bad.” But you—after this conversation—you see more. You see mechanisms. You see physics. You see evidence. You see communication.
You understand that sharp silvery whitening means crazing and probable brittleness. That diffuse chalky whitening means shear yielding and ductile behavior. That uniform early whitening in rubber-toughened material means toughening activation. That progressive whitening means damage accumulation. That ESC-accelerated whitening means chemical attack on stressed material.
This is reading the material’s language. This is understanding what it’s telling you. This is the holistic approach—connecting molecular mechanisms to microscopic structure to macroscopic observation to practical implications.
When a material whitens, it’s giving you information. That information has value—for quality control, for failure analysis, for design validation, for damage assessment. The material is trying to communicate. Your job is to be a good listener, a careful observer, a thoughtful interpreter.
Next time you see stress whitening—on a plastic part, in a test specimen, in a failed component—don’t just see “white.” See the story. See the mechanisms. See the material’s message.
Ask yourself: Why did it whiten here and not there? What does the pattern tell me about stress distribution? What does the character indicate about mechanism? Did it whiten early or late? Is this good (toughening activated) or bad (damage accumulated)? Is this progressive (ongoing) or static (past event)?
The material is talking. Listen carefully, and it will teach you what happened, why it happened, and what you should do about it.
That’s not just good engineering. That’s conversation with materials. That’s understanding that materials aren’t passive objects but active participants in the engineering process, constantly responding to what we do to them and showing us—if we’re willing to see—what those responses mean.
Stress whitening is one of the clearest, most visible ways materials communicate. They literally change appearance to show you internal change. They’re making it as obvious as possible: “Look at me! I’ve changed! Pay attention!”
So pay attention. Look carefully. Think deeply. Understand thoroughly. And let the material teach you what it knows.
That’s the gift of stress whitening. That’s the lesson it offers. That’s the holistic way of seeing material behavior—not as isolated phenomena to categorize and dismiss, but as communication, as evidence, as messages from materials trying to tell you their stories.
Listen to those stories. Learn from them. And use that knowledge to design better, build better, and understand better.
That’s what engineering is really about. That’s the art and the science together. That’s the conversation between us and the materials we work with.
Thanks for listening to this conversation. Now go look at some whitened plastic and see how much more you understand about what the material is showing you.
That’s the journey. That’s the learning. That’s the holistic way.
Now go do the work.
Joseph P. McFadden Sr.
Engineer, Lifelong Learner, Holistic Analyst
Combating Engineering Mind Blindness, One Student at a Time
Remember, every failure tells a story and understanding that story is the key to prevention.
Email: mcfadden@snet.net
Blog: www.mcfaddencae.com

Plastic Craze and Shear Yield
Link to audiobooks
Conversational Essay for Engineers → https://www.dropbox.com/scl/fi/g5j1uaxlu5nh5veldybze/Why_Plastics_Crack_McFadden.mp3?rlkey=vqxjcyvxarf5bkenb56q9025w&st=6abzo9em&dl=0
Crazing and Shear Yielding in Plastics: A Comprehensive Analysis
Enhanced with Thermodynamic Energy Perspectives
J.P. McFadden Sr. & Claude
November 2025 - Enhanced Edition
Introduction
When polymeric materials fail, they rarely do so through a single, simple mechanism. Instead, they exhibit complex deformation and fracture behaviors that reflect the unique molecular architecture of long-chain molecules. Two fundamental competing mechanisms dominate plastic deformation in glassy polymers: crazing and shear yielding. Understanding these mechanisms—their initiation, growth, competition, and ultimate role in fracture—is essential for designing durable plastic components and diagnosing failures.
This essay explores the physics, mechanics, and practical implications of crazing and shear yielding, examining how molecular structure, stress state, temperature, and strain rate determine which mechanism dominates. Critically, we now recognize that these mechanisms represent competing thermodynamic pathways, where surface energy plays the pivotal role in determining whether a polymer accommodates stress through ordered structural response (shear yielding) or entropy-driven disruption (crazing).
We'll see that these aren't merely academic curiosities but critical factors determining whether a plastic component performs reliably or fails catastrophically in service. The integration of Griffith's energy balance framework reveals that material behavior reflects an ongoing competition between molecular order (representing material "intelligence") and entropic disorder—a competition profoundly influenced by environmental factors.
The Nature of Glassy Polymers
Before diving into deformation mechanisms, we must understand what makes polymers unique. Unlike metals with their regular crystalline lattices and mobile dislocations, glassy polymers consist of long, entangled molecular chains frozen in random configurations below their glass transition temperature (Tg). At temperatures below Tg, these chains lack the thermal energy for large-scale rearrangement, creating a material that's rigid but also complex in its response to stress.
The molecular weight, chain entanglement density, crosslinking, and presence of secondary molecular motions all influence how these materials deform. When we apply stress to a glassy polymer, we're essentially asking these frozen, entangled chains to accommodate deformation—and they can respond in fundamentally different ways depending on the stress state and material characteristics.
From a thermodynamic perspective, the polymer's molecular architecture represents a state of organized complexity—a system where entropy has been temporarily suppressed during processing. The entangled chains, frozen below Tg, embody material "intelligence" in their ability to maintain structural order and resist random molecular motion. Deformation mechanisms represent different pathways by which this order can be disrupted or maintained under stress.
Crazing: Cavitation Under Constraint
What is a Craze?
A craze represents one of the most distinctive features of polymer deformation—a damage zone that appears crack-like at first glance but possesses unique properties that distinguish it from true cracks. Crazes are thin, planar zones of highly localized deformation oriented perpendicular to the maximum principal tensile stress. Under an optical microscope, they appear as bright, silvery bands due to their ability to scatter light.
The remarkable feature of crazes is their internal structure. Rather than being void spaces like cracks, crazes contain a network of highly oriented polymer fibrils bridging across the craze, spanning from one craze interface to the other. These fibrils, typically 5-30 nanometers in diameter, are separated by voids, creating a structure that's approximately 50% void and 50% highly drawn polymer. The fibrils themselves may be stretched to several times their original length, with polymer chains highly oriented along the stress direction.
This fibrillar structure gives crazes their unique mechanical properties: they can bear stress (unlike cracks), but they also represent zones of significant damage and reduced load-bearing capacity compared to the bulk material.
Thermodynamically, crazes represent a partial victory for entropy. The void formation dramatically increases the system's disorder, creating new surfaces that require energy to maintain. However, the bridging fibrils represent the material's residual order—the entangled network's last stand against complete disintegration. The energy required to create these new surfaces is the critical factor governing craze stability.
The Energy Balance: Griffith's Framework Applied to Crazing
The formation and growth of crazes can be understood through A.A. Griffith's 1921 energy balance framework, which revolutionized fracture mechanics by recognizing that crack propagation is fundamentally an energy problem, not merely a stress problem.
For a crack (or craze) of length 2a under tensile stress σ in a material with Young's modulus E, the critical stress for propagation is:
σc = √(2Eγ / πa)
where γ is the surface energy required to create new crack surfaces (typically 30-50 mJ/m² for polymers in air).
This equation reveals several critical insights:
Larger flaws reduce strength: As flaw size (a) increases, the critical stress decreases—explaining why surface scratches and internal defects are so damaging.
Surface energy is protective: Higher γ increases fracture resistance. This is why anything that reduces surface energy makes cracking easier.
Polymer crazes complicate the picture: In polymers, the effective surface energy is augmented by the plastic work required to draw fibrils. A craze isn't just creating void surfaces—it's also stretching highly oriented polymer chains across those voids.
This framework explains why environmental stress cracking (ESC) is so insidious: aggressive fluids reduce γ at craze interfaces, dramatically lowering σc. A craze that would remain stable in air becomes unstable in the presence of certain chemicals, not because the chemical dissolves the polymer, but because it reduces the energy cost of creating new surface area.
The energy balance for craze growth becomes:
Energy Input (from applied stress) ≥ Energy Cost (surface creation + fibril stretching + chain disentanglement)
When fluids reduce the surface energy term, the balance tips toward uncontrolled craze growth, converting what should be stable damage into catastrophic failure.
Craze Initiation
Crazing initiates when the local stress state satisfies specific criteria. The most widely accepted criterion for craze initiation comes from Sternstein and Ongchin, who proposed that crazing occurs when:
σ₁ - σ₂ ≥ A + Bσₘ
where σ₁ and σ₂ are the maximum and minimum principal stresses, σₘ is the mean stress (hydrostatic component), and A and B are material constants.
This criterion reveals that crazing requires both:
A deviatoric stress component (σ₁ - σ₂) to drive deformation and molecular chain orientation
A tensile hydrostatic stress component to promote void formation
The physical interpretation is illuminating: the deviatoric stress causes the initial plastic deformation and molecular chain orientation, while the tensile hydrostatic stress pulls the deforming material apart, creating voids between the orienting polymer chains. Without sufficient tensile hydrostatic stress, the material would deform by shear yielding instead.
From an energy perspective, the hydrostatic tension directly opposes the surface energy that resists void formation. The mean stress effectively "subsidizes" the energy cost of creating new surfaces, making crazing thermodynamically favorable when it would otherwise be prohibitive.
Craze initiation often occurs at stress concentrations—surface scratches, internal particles, molecular-level heterogeneities, or regions of residual stress. These defects create local stress states that exceed the craze initiation criterion even when the nominal applied stress is relatively low. This sensitivity to defects explains why surface finish, processing conditions, and contamination critically affect the strength of plastic components.
Craze Growth
Once initiated, a craze can grow in two directions: thickening (perpendicular to the craze plane) and widening (parallel to the craze plane, in the direction of applied stress). The mechanisms differ fundamentally:
Craze Thickening
The craze advances into the surrounding polymer by a process called "active zone" advancement. At the craze tip, polymer chains are drawn from the bulk material into the craze, undergoing enormous extension as they transform into the fibrillar structure. This process requires breaking or rearranging molecular entanglements, essentially "dissolving" the entanglement network at the craze tip and reconstituting it as oriented fibrils.
The rate of craze thickening depends on temperature, molecular weight, and applied stress:
Higher temperatures increase molecular mobility, facilitating chain disentanglement
Higher molecular weights increase entanglement density, requiring more stress or time to accomplish the transformation
Applied stress provides the driving force for chain extension and fibril formation
Energetically, craze thickening represents a continuous transformation process where:
Ordered entanglement network → Highly oriented fibrils + voids
Low entropy state → Higher entropy state (due to voids) + localized order (in fibrils)
The rate is controlled by the energy barrier to disentanglement and the driving force from applied stress.
Craze Widening
Crazes widen by advancing along their length, typically at stress concentrations at the craze tips. This lateral growth often follows planes of weakness or high stress. In some polymers, crazes can extend completely across a component, creating an array of bridging fibrils that still carry load but represent significant damage accumulation.
The Critical Role of Craze Fibrils
The fibrils bridging across a craze perform a crucial function: they transmit stress across what would otherwise be a void, preventing the craze from immediately becoming a propagating crack. The fibril structure imparts a kind of "toughness" to crazed material—energy must be expended to break the fibrils before crack propagation can occur.
However, fibrils are not permanent. They can fail by several mechanisms:
Fibril breakdown: Individual fibrils can rupture under sustained stress, especially in the presence of environmental agents
Meniscus instability: The fibril-void interface can become unstable, causing fibril collapse
Chain scission: Molecular bonds within highly stressed fibrils can break, particularly under fatigue loading or chemical attack
When sufficient fibrils have failed, the craze transforms into a crack, and rapid fracture can follow. This transition from craze to crack represents the critical moment when damage becomes catastrophic failure.
From an energy perspective, fibrils represent the material's last defense against entropy. They maintain partial structural integrity across the craze, requiring additional energy input to break. The fibril strength depends critically on:
Molecular weight (higher MW = more entanglements per fibril = higher strength)
Chain orientation (highly aligned chains can bear enormous stress)
Environmental factors (fluids that reduce surface energy also weaken fibrils)
The effective surface energy of a crazed region includes not just the void surfaces but also the work required to break fibrils:
γeffective = γsurface + γfibril-drawing + γfibril-rupture
This is why high molecular weight grades resist environmental stress cracking better—they increase γfibril-rupture, maintaining a higher energy barrier against catastrophic failure.
Environmental Stress Cracking: When Surface Energy Betrays the Material
Environmental stress cracking (ESC) represents the most important practical manifestation of the surface energy principle in crazing. ESC occurs when a polymer under stress fails prematurely in the presence of specific chemicals, even though neither the stress alone nor the chemical alone would cause failure.
The classic example is polyethylene bottles failing in contact with detergents, oils, or other organic liquids. This phenomenon costs industries billions of dollars annually in product failures and warranty claims.
Mechanisms of ESC
ESC works by dramatically accelerating crazing through reduction of surface energy:
1. Adsorption and the Dupré Effect
Fluid molecules adsorb onto polymer surfaces, replacing high-energy polymer-air interfaces (γPA) with lower-energy polymer-fluid (γPF) and fluid-air (γFA) interfaces. The Dupré equation quantifies this:
Δγ = γPA - (γPF + γFA)
For an aggressive ESC agent, Δγ is large and positive—meaning the fluid substantially reduces the effective surface energy. Surfactants in detergents are particularly effective because they align their hydrophobic tails toward the polymer surface, creating extremely low interfacial energy.
For example:
Polycarbonate in air: γ ≈ 45 mJ/m²
Polycarbonate in acetone: γ drops toward zero due to excellent molecular compatibility
2. Wetting and Capillary Penetration
Low contact angles enable fluid to spread into craze voids via capillary action. The penetration depth follows Washburn kinetics:
Penetration depth ∝ √t
Crazes, with their nanoporous fibrillar networks, act as highways for fluid transport. Aggressive fluids can reach craze tips in seconds, continuously reducing surface energy at the advancing crack front.
3. Plasticization
Compatible fluids slightly swell polymer chains, lowering the local glass transition temperature (Tg) and increasing molecular mobility. This:
Facilitates fibril drawing (reducing γfibril-drawing)
Eases chain disentanglement (lowering the energy barrier to craze growth)
Increases configurational entropy, further reducing energy barriers
Fluid Specificity: Solubility Parameters and Surface Energy
The specificity of ESC—why certain fluids attack certain polymers—arises from solubility parameter matching. Hildebrand's total solubility parameter (δ) provides a first approximation: "like dissolves like," but for ESC, "like attacks like."
Hansen solubility parameters refine this understanding by decomposing interactions into three components:
δtotal = √(δd² + δp² + δh²)
where:
δd = dispersion interactions (London forces)
δp = polar interactions (dipole-dipole)
δh = hydrogen bonding
For ESC susceptibility, close matching between fluid and polymer parameters correlates with:
High work of adhesion (WA)
Low interfacial energy (γPF)
Significant surface energy reduction per Dupré's equation
Examples:
Polyethylene (δ ≈ 16 MPa^1/2): Attacked by hydrocarbons, surfactants (δ ≈ 16-18)
Polycarbonate (δ ≈ 20 MPa^1/2): Attacked by alcohols, acetone (δ ≈ 19-21)
Polyethylene in water (δ ≈ 48 MPa^1/2): No ESC—huge parameter mismatch means minimal surface energy reduction
Kinetics and Field Observations
While thermodynamics determines whether ESC is possible, kinetics determines how fast it occurs. Field observations reveal counterintuitive behaviors:
Cyclic vs. Continuous Exposure
Intermittent application of aggressive fluids (e.g., repeated alcohol wiping of polycarbonate) is often more damaging than continuous immersion. Why?
Fresh fluid applications prevent stress relaxation
Each cycle accumulates irreversible damage
The material never gets time to redistribute stress through creep
From an entropy perspective: repeated cycles prevent any recovery of order
The Wet Storage Paradox
Parts stored wet at elevated temperature often resist ESC better than dry-stored parts subsequently exposed. The reason:
Elevated temperature accelerates stress relaxation (creep)
Residual stresses relax before fluid can fully reduce surface energy
Lower driving stress when γ finally drops
The material "learns" to accommodate the fluid environment
Localized Application
Swabs or sprays concentrate fluid at high-stress zones, outpacing global stress relaxation that would occur in immersion. This explains why cleaning procedures can be more damaging than service exposure.
Predicting and Preventing ESC
Understanding the surface energy mechanism enables rational prevention strategies:
Material Selection:
Choose polymers with higher surface energy (harder to reduce)
Select high molecular weight grades (stronger fibrils, higher γfibril-rupture)
Consider crystalline regions (resist fluid penetration, maintain structure)
Design Strategies:
Minimize sustained tensile stress
Avoid sharp corners and stress concentrations (reduce local stress intensification)
Design for compressive loading where possible (suppresses crazing entirely)
Processing Control:
Minimize residual stresses from molding, especially near surfaces
Optimize cooling rates to reduce internal stress
Consider annealing to relieve process-induced stress (lowers driving force for crazing)
Chemical Compatibility:
Test materials against intended environments using Hansen parameter mapping
Use barrier layers or coatings to prevent fluid contact
Consider chemical modification to increase surface energy in specific environments
Shear Yielding: Plastic Flow Without Cavitation
The Nature of Shear Yielding
Shear yielding represents the other fundamental deformation mechanism in glassy polymers—plastic flow driven by shear stress without the cavitation characteristic of crazing. When a polymer shear yields, molecular chains slide past one another, producing permanent deformation without creating voids or reducing density. The material necks down, thins, and elongates, similar to the yielding behavior of ductile metals, though the underlying molecular mechanisms differ profoundly.
During shear yielding, polymer chains undergo cooperative rearrangements. Molecular segments rotate, translate, and disentangle partially, allowing the material to flow plastically. Unlike crazing, which produces highly oriented fibrils bridging voids, shear yielding produces more uniform molecular orientation throughout the deformed region, with density remaining essentially constant.
From a thermodynamic and structural perspective, shear yielding represents material "intelligence" in action:
The polymer accommodates stress through organized molecular rearrangement
Entanglement network integrity is maintained, though locally disrupted
No catastrophic increase in surface area (no voids)
The material trades one form of order (random chain configurations) for another (oriented chains)
Entropy increases, but not as dramatically as in crazing
Shear yielding can be viewed as the material's "smart" response to stress—it deforms to relieve stress while preserving structural continuity.
Shear Yielding Mechanisms
The molecular mechanisms enabling shear yielding in glassy polymers remain subjects of active research, but several key processes are recognized:
Chain Segment Rotation
Below Tg, most polymer chains are frozen in place, but local molecular motions can still occur. Under applied shear stress, molecular segments can rotate around backbone bonds, allowing limited rearrangement without requiring full-chain diffusion. These local conformational changes accumulate to produce macroscopic plastic flow.
Energy perspective: Shear stress lowers the activation energy for local conformational changes, effectively "activating" molecular motions that would normally require higher temperatures.
Partial Disentanglement
While complete chain disentanglement would require temperatures above Tg, applied stress can promote partial, localized disentanglement. Molecular chains slide past one another at entanglement points, effectively reducing the local entanglement density and allowing plastic flow. The stress state "activates" molecular motions that would normally require higher temperatures.
Critically, this process maintains network connectivity—chains slide but don't separate completely, preserving structural integrity.
Free Volume Redistribution
Glassy polymers contain "free volume"—nanoscale voids between and within molecular chains. Under shear stress, this free volume can redistribute, migrating toward regions of high stress and facilitating molecular rearrangement. This free volume concept, developed by researchers like Eyring and Robertson, provides a framework for understanding how stress assists molecular mobility below Tg.
Thermodynamically: Free volume represents configurational entropy. Stress-driven redistribution increases local entropy in deforming regions while maintaining overall structural order.
Shear Band Formation
In many polymers, shear yielding doesn't occur uniformly but localizes into narrow "shear bands"—thin zones of intense plastic deformation oriented approximately 45° to the tensile axis (the plane of maximum shear stress). Within these bands, strain can reach several hundred percent while surrounding material remains elastic or only lightly deformed.
Multiple shear bands may form and propagate, distributing deformation and contributing to ductility.
Energetically, shear bands represent:
Localized entropy maxima (high molecular mobility, disorder)
But surrounded by ordered matrix
A compromise between global disorder (catastrophic) and rigid order (brittle)
Yield Criteria
The onset of shear yielding is typically described by yield criteria similar to those used for metals. The von Mises criterion states that yielding occurs when:
(σ₁ - σ₂)² + (σ₂ - σ₃)² + (σ₃ - σ₁)² ≥ 2σy²
where σ₁, σ₂, σ₃ are principal stresses and σy is the yield strength. This criterion depends only on the deviatoric stress components (shape change), not the hydrostatic component (volume change).
However, polymers often deviate from von Mises behavior. Many glassy polymers exhibit pressure-dependent yielding, where compressive hydrostatic stress increases the yield strength. This pressure sensitivity distinguishes polymers from most metals and reflects the influence of free volume and molecular packing on yield behavior.
The Mohr-Coulomb criterion captures this pressure dependence:
τ = c + μσn
where τ is shear stress, σn is normal stress, c is cohesion, and μ is an internal friction coefficient. This criterion, borrowed from soil mechanics, describes polymers where compressive normal stress increases shear strength—behavior commonly observed in many glassy polymers.
Physical interpretation: Compressive stress:
Reduces free volume (less room for chain rearrangement)
Increases entanglement density
Raises the energy barrier to molecular motion
Makes plastic flow harder
The Competition: Crazing vs. Shear Yielding
What Determines the Dominant Mechanism?
The most critical question for understanding polymer behavior is: under what conditions does crazing dominate versus shear yielding? The answer determines whether a component fails in a brittle, catastrophic manner (crazing leading to crack propagation) or deforms ductilely with warning (shear yielding with necking).
From our enhanced thermodynamic perspective, this competition represents a choice between two energetic pathways:
Crazing path: Create voids (high surface energy cost) + draw fibrils (plastic work) → Entropy increases dramatically
Shear yielding path: Molecular rearrangement (lower activation energy) → Moderate entropy increase, order maintained
The pathway taken depends on which has the lower total energy barrier under the prevailing conditions.
Several factors govern this competition:
Stress State
Hydrostatic Tension Promotes Crazing
The most important factor is the hydrostatic stress component. Tensile hydrostatic stress (positive mean stress) strongly promotes crazing by facilitating void formation. The Sternstein-Ongchin criterion explicitly includes mean stress, showing that increasing hydrostatic tension lowers the stress required for crazing.
Thermodynamically: Hydrostatic tension directly opposes the surface energy (γ) that resists void formation. It effectively "pays" part of the energy cost, making the crazing pathway thermodynamically favorable.
Conversely, compressive hydrostatic stress suppresses crazing by opposing void formation. Under sufficient compression, crazing becomes thermodynamically impossible (you can't create voids when pressure is pushing the material together), and the material must deform by shear yielding if it deforms at all.
Geometry and Loading Create Stress States
Component geometry and loading conditions determine the local stress state. Consider these examples:
Uniaxial tension: Creates positive hydrostatic stress (σm = σ/3), promoting crazing. Most polymers will craze under uniaxial tension before shear yielding occurs, especially in the presence of stress concentrations.
Pure shear: Creates zero mean stress (σm = 0), favoring shear yielding over crazing. Thin-walled tubes under torsion approximate pure shear and typically show shear yielding.
Confined compression: Creates negative hydrostatic stress, suppressing crazing completely. Polymers under high confinement deform by shear yielding even if they would normally be craze-prone.
Triaxial tension: Creates high positive hydrostatic stress, strongly promoting crazing. Notched specimens under tension create triaxial stress states near the notch root, explaining why notches are particularly damaging to polymers—they shift the stress state toward the crazing pathway.
This stress state dependence explains why the same material can be brittle or ductile depending on component geometry—it's not a material property change, but a shift in which deformation pathway is thermodynamically favored.
Temperature
Temperature profoundly affects the crazing vs. shear yielding competition, but in a complex manner. As temperature increases toward Tg:
Molecular Mobility Increases
Higher temperature increases chain segment mobility, facilitating both craze fibril formation and shear yielding. However, the temperature sensitivity of these two mechanisms differs.
Brittle-to-Ductile Transition Temperature (BDTT)
Many polymers exhibit a "brittle-to-ductile transition temperature" where the dominant deformation mechanism shifts from crazing to shear yielding:
Below BDTT: Crazing dominates and fracture occurs at low strains with limited energy absorption (brittle failure)
Above BDTT: Shear yielding dominates, producing ductile behavior with necking and high energy absorption before failure
The BDTT doesn't represent a material property change at that temperature—both mechanisms remain possible across the temperature range. Rather, it reflects the shifting competition between mechanisms as temperature alters their relative kinetics.
Thermodynamic interpretation: As temperature rises:
Activation energy for shear yielding decreases faster than for crazing
Molecular mobility allows stress relaxation, reducing driving force
Above BDTT, shear yielding occurs fast enough to outpace craze initiation
The material effectively "chooses" the lower-energy pathway (shear yielding) when given sufficient thermal activation
Near-Tg Behavior
As temperature approaches Tg, molecular mobility increases dramatically:
Shear yielding becomes progressively easier
Materials that are brittle and craze-prone at room temperature may become highly ductile
Materials that shear yield at room temperature may show extensive necking and drawing
This temperature dependence reveals that deformation mechanism is not an intrinsic material property but a competition between pathways influenced by environmental conditions.
Strain Rate
Strain rate—the speed at which load is applied—influences the crazing-shear yielding competition through its effect on molecular relaxation:
High Strain Rates Promote Crazing
Rapid loading doesn't allow time for the molecular rearrangements necessary for shear yielding. The material behaves more "glassy," and stress concentrations build rapidly, promoting crazing.
Thermodynamically: Fast loading means:
Insufficient time for stress-activated molecular motions
Shear yielding pathway becomes kinetically inaccessible
Crazing pathway (which can occur faster) dominates
The material is "forced" into the higher-entropy pathway because the lower-entropy pathway is too slow
This explains why the same polymer can exhibit ductile behavior in a slow tensile test but fail in a brittle, crazed manner under impact. The Charpy or Izod impact tests exploit this effect, using high strain rates to reveal a material's impact brittleness.
Low Strain Rates Favor Shear Yielding
Slow loading allows molecular relaxation processes to occur, facilitating shear yielding. Stress concentrations relax through local plastic flow rather than accumulating to craze initiation levels.
This time-dependent behavior means that creep loading (constant low stress over long times) often produces shear yielding even in materials that would craze under rapid loading.
The material "has time" to explore lower-energy conformational states, choosing shear yielding over crazing when kinetically possible.
Rate-Temperature Equivalence
The effects of strain rate and temperature are related through time-temperature superposition. Increasing temperature has a similar effect to decreasing strain rate—both allow more molecular relaxation.
A material tested at:
High temperature + high strain rate ≈ Low temperature + low strain rate
This equivalence principle allows prediction of behavior across conditions and explains many apparently contradictory field observations.
Molecular Weight and Architecture
Molecular Weight Effects
Molecular weight strongly influences deformation mechanisms through its effect on entanglement density:
Low molecular weight polymers (below the critical entanglement molecular weight, Mc):
Chains aren't entangled
Low strength and limited capacity for either crazing or shear yielding
Often fail by chain pullout (no ordered response possible)
Minimal material "intelligence"
Moderate molecular weight (above Mc but not extremely high):
Entanglements provide strength but can be overcome by stress
Often show crazing because entanglement rearrangement is difficult
Void formation provides an alternative deformation path
Lower γfibril-rupture makes crazes more vulnerable
High molecular weight:
Very high entanglement density
Increased strength but also makes shear yielding more difficult
Paradoxical effect on crazing: More entanglements make craze fibril formation harder, BUT once formed, high MW fibrils are much stronger (higher γfibril-rupture)
Generally better ESC resistance due to stronger fibrils
From an energy perspective: Higher MW increases the "material intelligence quotient"—more entanglements mean more organized structure to maintain, higher energy barriers to disruption, and better resistance to entropy-driven failure.
Chain Architecture
The molecular architecture beyond simple molecular weight also matters:
Linear chains: More mobile, facilitate shear yielding (can rearrange more easily)
Branched chains: Branch points act as physical crosslinks, hindering both crazing and shear yielding but affecting them differently. Branches increase the energy cost of chain rearrangement.
Crosslinked polymers: Chemical crosslinks prevent chain slippage, suppressing shear yielding. Such materials often must craze or fracture brittlely since plastic flow by chain slippage is thermodynamically prohibited. The material "loses" its ability to respond intelligently through shear yielding.
Rubber Toughening: Engineering the Competition
One of the most successful strategies for improving polymer toughness exploits the crazing-shear yielding competition through deliberate microstructural design. Rubber-toughened polymers contain dispersed rubber particles (typically 0.1-10 μm diameter) distributed throughout a glassy polymer matrix.
These rubber particles don't significantly strengthen the material—in fact, they slightly reduce yield strength—but they dramatically increase toughness by altering the energetic landscape of deformation mechanisms.
How Rubber Particles Work: An Energy-Based Mechanism
The mechanism is elegant and reveals deep insights into the thermodynamic competition:
1. Stress Concentration
The modulus mismatch between soft rubber particles (E ≈ 1-10 MPa) and stiff matrix (E ≈ 2-3 GPa) creates stress concentrations around particles under applied load.
2. Controlled Cavitation
These stress concentrations cause cavitation within or around rubber particles, creating small voids at relatively low applied stress—much lower than the craze initiation stress of the matrix.
3. Hydrostatic Stress Relief (The Key Step)
The formation of these small, controlled voids relieves hydrostatic tension locally. This is the critical thermodynamic shift:
Before cavitation: High σm → Crazing pathway favored
After cavitation: Low σm → Shear yielding pathway favored
The rubber particles essentially "pay" the surface energy cost of void formation at low stress, changing the local stress state from one that promotes catastrophic crazing to one that promotes controlled shear yielding.
4. Multiple Shear Yielding
With crazing suppressed (low hydrostatic tension) and stress concentrations present (high shear stress), multiple shear bands initiate throughout the material. Plastic deformation distributes over a large volume rather than concentrating in a single craze that could evolve into a crack.
Energetically: Rubber toughening works by:
Reducing the "subsidy" that hydrostatic tension provides to surface energy
Making the crazing pathway thermodynamically less favorable
Simultaneously making shear yielding more accessible (high shear stress)
Distributing energy dissipation across many shear bands instead of one craze
Examples and Effectiveness
This mechanism explains why:
High-Impact Polystyrene (HIPS) and ABS are so much tougher than pure polystyrene, despite similar yield strengths
The rubber particles convert what would be brittle, crazed fracture into ductile failure with extensive shear yielding
Toughening effectiveness depends on particle size, distribution, and volume fraction—all of which influence the stress field and local energy balance
The material is "taught" to respond intelligently (shear yielding) rather than catastrophically (crazing) through clever microstructural engineering that manipulates local thermodynamics.
Practical Implications for Design and Failure Analysis
Design Considerations
Understanding crazing, shear yielding, and their energetic foundations enables intelligent design decisions:
When Ductility is Critical
For applications requiring impact resistance or overload protection, design to promote shear yielding:
Avoid sharp notches and stress concentrations that create triaxial tension (high σm)
Consider rubber-toughened grades (manipulate local stress state)
Operate at temperatures above the BDTT (make shear yielding kinetically favorable)
Design for lower strain rates where feasible (allow time for molecular relaxation)
Avoid thin sections that constrain deformation (plane strain conditions increase σm)
When Dimensional Stability is Critical
For applications requiring tight tolerances under sustained load:
Both crazing and shear yielding represent unwanted permanent deformation
Design for low stress levels below both craze initiation and yield stress
Consider crystalline polymers (higher creep resistance, better structural order)
Use reinforced grades (fibers constrain deformation)
Operate at lower temperatures (reduces molecular mobility, maintains order)
When Environmental Exposure is Expected
For applications involving chemical contact (the ESC case):
Test for ESC with actual service chemicals using Hansen parameter screening
Design for compressive rather than tensile stress (suppresses crazing thermodynamically)
Minimize surface stress concentrations where chemical contact occurs (reduce local stress intensification)
Consider barrier coatings or multi-layer structures (prevent surface energy reduction)
Use crystalline polymers (better chemical resistance, crystalline regions maintain order)
Select high molecular weight grades (stronger fibrils, higher γfibril-rupture)
Failure Analysis: Reading the Evidence
When a plastic component fails, the fracture surface tells stories about the mechanisms involved—and the thermodynamic pathways taken—if we're willing to listen:
Crazed Failures
Crazed regions appear whitened or silvery due to light scattering from voids (refractive index contrast). Under magnification:
Crazes appear as parallel lines perpendicular to the tensile stress
Multiple crazes may be present, often initiating from stress concentrations
Crack initiation sites often show dense craze networks
The crack path may follow craze planes
A predominantly crazed fracture suggests:
High hydrostatic tension (notched geometry, triaxial stress state)
Temperature below BDTT (shear yielding kinetically suppressed)
Rapid loading/impact (insufficient time for relaxation)
Possible ESC if chemical exposure occurred (surface energy reduction)
Material with high craze susceptibility (low MW, no rubber toughening, low γfibril-rupture)
Thermodynamic interpretation: The crazing pathway was energetically favored—either through high σm reducing the energy barrier or through environmental surface energy reduction (ESC).
Shear Yielded Failures
Shear yielding produces:
Necking or drawing visible at the macroscopic scale
Whitening from light scattering due to void formation or molecular orientation (different mechanism than craze whitening)
Shear bands visible under magnification (typically ~45° to tensile axis)
Ductile, fibrous fracture surfaces
A predominantly shear yielded fracture suggests:
Lower hydrostatic tension (less constraint, lower σm)
Temperature above BDTT (shear yielding kinetically accessible)
Slower loading rates (time for molecular relaxation)
Material with good ductility (higher MW, rubber toughening, good "material intelligence")
Thermodynamic interpretation: The shear yielding pathway was energetically favored—low σm maintained high surface energy cost for crazing, temperature/strain rate allowed molecular rearrangement.
Mixed Mode Failures
Many real failures show both crazing and shear yielding:
Crazes may initiate first, creating stress concentrations that trigger shear yielding
Shear bands may form between crazes
The crack may alternate between following craze planes and cutting through shear-yielded regions
Mixed-mode fractures often indicate:
Operation near the brittle-ductile transition (marginal thermodynamic competition)
Variable local stress states within the component
Changes in loading rate during the failure process
Partial effectiveness of toughening mechanisms (some regions toughened, others not)
Thermodynamic interpretation: The material was "on the fence" energetically—some regions favored crazing, others shear yielding, revealing the competitive nature of these pathways.
Case Examples with Energy Analysis
Case 1: Snap-Fit Failure
Scenario: A polycarbonate electrical connector fails at snap-fit hooks after months in service.
Examination reveals:
Dense craze networks at hook roots
Environmental exposure to cleaning solvents (isopropanol)
High local stress at sharp corners (stress concentration)
Analysis:
Mechanical: Sharp corners create triaxial tension at hook roots (high σm)
Environmental: Isopropanol (δ ≈ 23 MPa^1/2) matches PC (δ ≈ 20 MPa^1/2)
Thermodynamic: Solvent reduces γ at craze interfaces dramatically (Dupré effect)
Result: σc drops far below design stress; stable crazes become unstable
Solutions:
Increase fillet radii (reduce σm, lower stress concentration)
Switch to solvent-resistant grade (increase γ, wider δ mismatch)
Eliminate cleaning chemical contact (barrier coating)
Use mechanical snap design that favors compression (suppress crazing thermodynamically)
Case 2: Impact Failure
Scenario: An ABS automotive component fails under impact that similar components previously survived.
Investigation shows:
Brittle fracture with limited crazing
Testing reveals low temperature at failure time (-10°C)
Material operated below BDTT (~0°C for this grade)
Analysis:
Temperature: Below BDTT, shear yielding kinetically suppressed
Strain rate: Impact loading (no time for relaxation)
Thermodynamic: Only crazing pathway accessible; rubber toughening ineffective at low temperature
Rubber particles: Cannot cavitate effectively when rubber phase is glassy
Solution:
Redesign for lower operating temperature (specify BDTT < -20°C)
Switch to lower-BDTT material (different polymer or rubber phase)
Reduce stress concentrations to lower σm even at low temperature
Consider using material with better low-temperature toughening
Case 3: Creep Failure
Scenario: A polypropylene pressure vessel slowly deforms and eventually fails under constant pressure.
Examination reveals:
Extensive shear yielding and necking
Whitening throughout stressed regions (shear yielding type)
No evidence of crazing
Failure after months of service under constant 60% of rated pressure
Analysis:
Stress state: Biaxial tension (moderate σm, not triaxial)
Strain rate: Very slow (creep conditions)
Thermodynamic: Slow loading allowed continuous stress relaxation; shear yielding pathway accessible and lower-energy than crazing
Progressive: Deformation gradually reduced wall thickness, increasing stress, accelerating further deformation (positive feedback)
Solution:
Reduce design stress to account for creep (50% of yield → 30% of yield)
Increase wall thickness (margin for creep deformation)
Select higher-creep-resistance material (more crystalline PP, fiber reinforcement)
Consider time-temperature superposition in design calculations
Advanced Topics: Connecting Scales and Perspectives
Craze Fracture Mechanics
Researchers have developed fracture mechanics approaches specifically for crazed materials. Unlike linear elastic fracture mechanics (LEFM), which assumes crack tips are singular stress concentrations, craze fracture mechanics recognizes that crazes have finite tip dimensions and bear stress through their fibrillar structure.
The "craze toughness" Gc represents the energy required to extend a craze and break its fibrils. For many polymers, this craze toughness dominates the overall fracture toughness.
The fracture process involves:
Craze initiation at a flaw or stress concentration (overcome γ barrier)
Craze growth—thickening and widening (continuous energy input)
Fibril formation within the growing craze (plastic work, chain disentanglement)
Fibril breakdown (overcome γfibril-rupture), converting craze to crack
Crack propagation through bulk material or along craze-bulk interfaces
Energy balance perspective:
Gc,total = γsurface + γfibril-drawing + γfibril-rupture + γplastic
Each term represents an energy dissipation mechanism. High molecular weight increases γfibril-rupture; rubber toughening adds γplastic through multiple shear bands.
Understanding this sequence enables modeling crack growth rates in polymers under:
Fatigue loading (cyclic fibril stress)
Creep (time-dependent fibril degradation)
ESC conditions (fluid reduces multiple γ terms)
Computational Modeling
Modern finite element analysis (FEA) increasingly incorporates sophisticated constitutive models capturing both crazing and shear yielding. These models must account for:
Pressure-Dependent Plasticity
Unlike metals, polymers show yield strength dependence on hydrostatic pressure (σm). Modified Drucker-Prager or Mohr-Coulomb criteria capture this effect, enabling prediction of where shear yielding will initiate based on local stress state.
Craze Initiation and Growth
Some advanced models include craze initiation criteria based on local stress state (Sternstein-Ongchin) and accumulated plastic strain. Craze growth can be modeled by introducing material softening in regions meeting craze criteria, with special elements representing the craze fibrillar structure (reduced modulus but non-zero stress-bearing capacity).
Damage Accumulation
Both crazing and shear yielding represent damage—permanent changes that reduce material load-bearing capacity. Progressive damage models track this degradation:
Crazing: Reduces effective load-bearing area, creates stress concentrations
Shear yielding: Reduces local stiffness, changes geometry (necking)
Models predict eventual failure as damage accumulates to critical levels.
Rate and Temperature Dependence
Sophisticated constitutive models incorporate viscoelastic-viscoplastic behavior, capturing how:
Yield strength varies with strain rate and temperature
Craze initiation stress changes with conditions
BDTT shifts with strain rate
ESC susceptibility depends on exposure kinetics
These computational approaches enable virtual testing of designs, predicting failure modes and locations before physical prototypes exist. Increasingly, they incorporate energy-based failure criteria that directly calculate:
Local surface energy based on stress state
Energy available for crack propagation (G)
Critical energy release rate (Gc)
Pathway competition (crazing vs. shear yielding) based on relative energy barriers
Nano-Scale Perspectives
Recent research using atomic force microscopy (AFM), scanning electron microscopy (SEM), and transmission electron microscopy (TEM) has revealed nano-scale details of crazing and shear yielding:
Craze Structure
High-resolution imaging shows that craze fibrils aren't uniform cylinders but have complex internal structure:
Individual fibrils may contain multiple molecular bundles
Void spaces exist between bundles within fibrils
Fibrils show periodic variations in thickness (possibly related to MW distribution)
Chain orientation varies across fibril diameter
Energy implications: The nano-structure affects:
Effective surface area (more complex than assumed)
Fibril strength (non-uniform stress distribution)
Failure modes (where does rupture initiate within fibrils?)
Shear Band Structure
Nano-scale examination of shear bands reveals:
Highly localized deformation zones (sometimes only 100-200 nm thick)
Enormous local strains (>200%)
Within shear bands: free volume increases, molecular orientation develops
Regions of fundamentally altered structure (locally approaching rubbery state)
Energy perspective: Shear bands are entropy maxima—regions where the Second Law has locally "won" but remain contained within an ordered matrix.
Craze-Shear Interaction
At the nano-scale, the boundary between crazing and shear yielding blurs:
Some materials show "hybrid" structures with characteristics of both mechanisms
Craze tips can trigger shear band nucleation
Shear bands can initiate crazes through stress concentration
The competitive/cooperative nature is more complex than macroscopic models assume
Understanding these nano-scale phenomena may enable development of polymers with enhanced toughness through controlled deformation mechanisms—materials that intelligently select the optimal response at each scale.
Conclusion: Materials Tell Us How They Want to Deform
The competition between crazing and shear yielding represents a fundamental aspect of polymer behavior—two distinct molecular responses to applied stress, each representing a different thermodynamic pathway with its own energetics, advantages, and failure modes.
From our enhanced energy perspective, we understand that:
Crazing represents an entropy-driven pathway where void formation dramatically increases disorder, enabled when surface energy (γ) is low or when hydrostatic tension (σm) subsidizes the energy cost. Environmental fluids accelerate this pathway by reducing γ.
Shear yielding represents the material's "intelligent" response—organized molecular rearrangement that maintains structural integrity while accommodating stress. This pathway is favored when crazing is thermodynamically expensive (high γ, low σm) or when temperature/strain rate make it kinetically accessible.
The competition between these mechanisms isn't random—it's determined by which pathway has the lower total energy barrier under prevailing conditions. We can manipulate this competition through:
Material selection (molecular weight, architecture affecting γfibril-rupture)
Design (geometry determining σm)
Processing (residual stress, molecular orientation)
Environment (temperature, chemical exposure affecting γ)
Microstructure (rubber toughening manipulating local stress state)
Understanding this competition enables:
Intelligent Material Selection: Choose polymers whose deformation mechanisms match application requirements through understanding of their energetic landscape
Thoughtful Design: Create geometries and loading conditions that promote beneficial deformation mechanisms (shear yielding for toughness) while thermodynamically suppressing harmful ones (crazing for brittle failure)
Effective Failure Analysis: Read the evidence on fracture surfaces to understand the energetic pathway taken. Was crazing triggered by ESC (γ reduction), stress concentrations (high σm), or operating below BDTT? Did shear yielding lead to excessive creep? Let the material tell you its thermodynamic story.
Innovative Materials Development: Understanding fundamental mechanisms enables rational toughening strategies. Rubber-toughened polymers succeed by manipulating the crazing-shear yielding competition at the microstructural level through stress state engineering. Future developments may offer even more sophisticated control over deformation mechanisms through hierarchical structures, self-healing systems, or responsive materials.
Perhaps most importantly, the study of crazing and shear yielding, enhanced by thermodynamic and energy perspectives, illustrates a central truth of materials science: materials aren't passive objects that simply "have" properties. They're complex systems with internal structure, molecular architecture, and multiple possible responses to stress—each representing a different point on an energy landscape.
The material's "choice" of deformation mechanism reflects thermodynamic principles: it follows the path of least resistance, the pathway requiring the minimum energy input under prevailing conditions. Our job as engineers and scientists isn't to force materials to behave as we wish—it's to:
Understand the energy landscape they navigate
Shape that landscape through material selection, design, and processing
Work with their natural tendencies to create successful designs
Learn from failures by reading the thermodynamic story written in crack patterns
When we see crazes forming under a microscope or observe necking in a tensile test, we're witnessing molecular-scale thermodynamics playing out at the macroscopic scale—billions of molecular chains responding to stress according to Griffith's energy balance, their architecture, their environment, and the fundamental physics governing their behavior.
The integration of surface energy considerations transforms our understanding: ESC isn't mysterious chemical attack—it's thermodynamics in action, where fluids reduce γ and tip the energy balance toward entropy's victory. Rubber toughening isn't just empirical magic—it's clever manipulation of local stress states to shift the thermodynamic competition toward shear yielding.
This molecular-to-macro, thermodynamic-to-practical perspective transforms failure analysis from post-mortem examination into dialogue with materials, where failures become teachers if we're willing to listen to what they're telling us about the energetic pathways they explored.
By understanding that materials embody a competition between order and entropy, between structural intelligence and thermodynamic inevitability, we can engineer resilience into plastic components. We design with thermodynamics, not against it, creating structures that channel stress along energetically favorable pathways that lead to safe, predictable outcomes rather than catastrophic failures.
The lesson is profound: Listen to the material. Understand its energetic preferences. Shape the landscape it navigates. And it will reward you by performing reliably in service, telling you when it's stressed, and failing gracefully when it must fail at all.
Further Reading and Key References
Foundational Works on Crazing
Kambour, R.P. (1973). "A Review of Crazing and Fracture in Thermoplastics." Journal of Polymer Science: Macromolecular Reviews, 7, 1-154. [Comprehensive review of early crazing research]
Kramer, E.J. (1983). "Microscopic and Molecular Fundamentals of Crazing." Advances in Polymer Science, 52/53, 1-56. [Detailed mechanism of craze formation and growth]
Sternstein, S.S., & Ongchin, L. (1969). "Yield Criteria for Plastic Deformation of Glassy High Polymers in General Stress Fields." Polymer Preprints, 10(2), 1117-1124. [Original craze initiation criterion]
Shear Yielding Mechanisms
Bowden, P.B., & Raha, S. (1974). "A Molecular Model for Yield and Flow in Amorphous Glassy Polymers Making Use of a Dislocation Analogue." Philosophical Magazine, 29(1), 149-166.
Argon, A.S. (1973). "A Theory for the Low-Temperature Plastic Deformation of Glassy Polymers." Philosophical Magazine, 28(4), 839-865.
Rubber Toughening
Bucknall, C.B. (1977). Toughened Plastics. Applied Science Publishers. [Definitive text on rubber toughening mechanisms]
Yee, A.F., & Pearson, R.A. (1986). "Toughening Mechanisms in Elastomer-Modified Epoxies." Journal of Materials Science, 21, 2462-2474.
Environmental Stress Cracking and Surface Energy
Arnold, J.C. (1995). "Environmental Stress Crack Initiation in Glassy Polymers." Trends in Polymer Science, 3(1), 14-20.
Hansen, C.M. (2007). Hansen Solubility Parameters: A User's Handbook. CRC Press. [Predicting polymer-solvent interactions relevant to ESC]
Wright, D.C. (2001). Environmental Stress Cracking of Plastics. RAPRA Technology. [Comprehensive practical guide to ESC testing and prediction]
Fracture Mechanics and Energy Approaches
Griffith, A.A. (1921). "The Phenomena of Rupture and Flow in Solids." Philosophical Transactions of the Royal Society of London, A221, 163-198. [Original energy balance framework]
Williams, J.G. (1984). Fracture Mechanics of Polymers. Ellis Horwood. [Application of fracture mechanics to polymers]
Modern Perspectives
Meijer, H.E.H., & Govaert, L.E. (2005). "Mechanical Performance of Polymer Systems: The Relation Between Structure and Properties." Progress in Polymer Science, 30, 915-938.
Haward, R.N., & Young, R.J. (1997). The Physics of Glassy Polymers, 2nd Edition. Chapman & Hall. [Comprehensive modern treatment]
J.P. McFadden Sr.
November 2025 - Enhanced Edition
Integrating Surface Energy and Thermodynamic Perspectives on Polymer Deformation

PPSu
Link to audiobook→ https://www.dropbox.com/scl/fi/n80lba1528ja06jtpyq62/filtered_Public_version_Polymerize_PPSu_McFadden_17March2026.mp3?rlkey=jgsac055ndnblen8zxuov2ms5&st=t9uaixpe&dl=0
HOW PPSU IS MADE
The Complete Polymerization of Polyphenylsulfone
From Raw Materials to Finished Polymer
An Audiobook Companion Reader
A Deep Dive for the Curious Mind
Joseph P. McFadden Sr.
Materials Engineer | 19+ Years in Healthcare Polymer Applications
March 2026
Part of the Building Intuition Before Equations Series
Created through collaboration with Claude and Grok AI
Audio narration by ElevenLabs
About This Reader
This companion reader accompanies the audiobook “How PPSU Is Made.” It was developed by me, Joe McFadden based on over 19 years of personal research and experience working with PPSU in healthcare device housings.
It is provided as a learning guide for my team and for anyone who wants to understand, at a detailed level, how this remarkable polymer is actually made—from the raw materials that become monomers, through the precision chemistry of polycondensation, to the pellets that arrive at our molding machines. No chemistry degree required. Just curiosity.
• • •
Introduction: Before There Is a Polymer, There Are Two Monomers
Every polymer starts as something simpler. Before you have a long chain, you need the individual links. In the case of polyphenylsulfone (PPSU), those links are two small molecules—called monomers—that are designed to snap together in a very specific way.
The first monomer is 4,4′-dichlorodiphenyl sulfone, which chemists call DCDPS. It carries the sulfone group (SO₂) that gives PPSU its heat resistance and chemical toughness. It also carries two chlorine atoms, which play a critical role in the reaction and later become the subject of a regulatory conversation.
The second monomer is 4,4′-biphenol (4,4′-dihydroxybiphenyl). This is the piece that gives PPSU its structural rigidity and impact strength. It carries two hydroxyl groups (–OH), and those are the atoms that will form the new bonds during polymerization.
Neither of these monomers occurs in nature. Both must be manufactured through their own multi-step chemical processes. Understanding how they are made helps you understand why PPSU has the properties it does—and why that residual chlorine ends up in the final product.
Part 1: Making the First Monomer — DCDPS
The starting material is chlorobenzene—one of the simplest aromatic compounds available in industrial quantities. In chemistry, aromatic refers to molecules built around benzene rings: flat, hexagonal structures of six carbon atoms connected by a shared cloud of electrons that makes them exceptionally stable and chemically resistant. (The name originally came from the distinctive smell of these compounds, though today it refers strictly to the ring structure.) Chlorobenzene is a benzene ring with a single chlorine atom attached. Think of it as a hexagonal plate with one hook on the edge.
The goal is to take two chlorobenzene molecules and join them through a sulfone bridge (a sulfur atom bonded to two oxygen atoms, –SO₂–). This sulfone bridge is what will eventually give PPSU its extraordinary thermal and chemical stability.
The Sulfonation Reaction
Chlorobenzene is reacted with sulfur trioxide (SO₃), a powerful sulfonating agent. SO₃ attacks the electron-rich benzene ring in a reaction called electrophilic aromatic substitution. In chemistry, “attack” simply means one molecule, driven by its electrical charge, moves toward another and forms a new bond—like a magnet snapping onto metal. SO₃ is electron-hungry (partially positive), and the benzene ring is electron-rich (a flat disc with electron clouds above and below). The SO₃ is drawn in, latches on, and a new bond forms. The first step produces an intermediate: 4-chlorobenzenesulfonic acid—one chlorobenzene molecule with a sulfonic acid group (–SO₃H) attached at the para position, directly across from the chlorine.
This intermediate then reacts with a second molecule of chlorobenzene in another electrophilic substitution, producing the final product: two chlorobenzene rings joined by a sulfone bridge. That is DCDPS.
Isomer Control and Purification
When SO₃ attacks chlorobenzene, it can attach at different positions on the ring. The 4,4′ isomer—where both chlorines are directly across from the sulfone bridge—is the desired product. (An isomer is a molecule with the same atoms as another but arranged in a different pattern—same ingredients, different structure, like rearranging furniture in a room.) The reaction also produces small amounts of 2,4′ and 3,4′ isomers that would create defects in the polymer.
Purification is achieved through fractional crystallization—a technique that exploits how different molecules dissolve and crystallize at different rates. The crude DCDPS is dissolved in a hot solvent, then cooled slowly. The desired 4,4′ isomer crystallizes out first (melting point ~148°C), while unwanted isomers remain in the liquid (the "mother liquor"). Multiple cycles bring purity above 99.8%—the level required for polymer-grade material.
What you end up with is a white crystalline solid. Stable, easy to handle, and ready for polymerization. Each molecule carries exactly two chlorine atoms in precisely the right positions. Those chlorine atoms are about to become what chemists call leaving groups—atoms bonded to a molecule temporarily, holding a position like a placeholder in a seat, designed to depart when a stronger bonding partner arrives. During polymerization, each chlorine will release its bond, step aside as a chloride ion, and pair with potassium to form KCl (ordinary salt). But not every chlorine successfully leaves—some remain at chain ends or as trapped monomer, producing the residuals discussed later.
Part 2: Making the Second Monomer — Biphenol
The second monomer, 4,4′-biphenol, has its own fascinating origin story—and it starts with a problem.
You might think you could simply oxidize two phenol molecules together into a biphenyl structure. In principle, you can. But phenol coupling is messy: the oxidation attaches the rings at multiple positions, giving a mixture of isomers. For PPSU, we only want the 4,4′ version, where both hydroxyl groups point away from each other at opposite ends.
The Hay Process
The industrial solution, developed by Allan Hay in the 1960s, is elegant. Instead of phenol, you start with 2,6-di-tert-butylphenol. Picture a phenol molecule with two large, bulky tert-butyl groups—like boulders—sitting on either side of the hydroxyl group. These block the 2 and 6 positions. The only place coupling can happen is at the para position.
Exposure to oxygen generates phenoxy radicals—reactive intermediates with unpaired electrons. Two radicals find each other and couple at the only available position, forming a carbon–carbon bond between the rings. The initial product is a brightly colored diphenoquinone intermediate.
Dealkylation
The diphenoquinone is reduced back to a dihydroxy form, then treated with an acid catalyst at elevated temperature. This drives dealkylation—the removal of alkyl groups (chains of carbon and hydrogen). The tert-butyl groups break away as isobutylene gas. What remains is pure 4,4′-biphenol—two phenol rings connected at their para positions, with hydroxyl groups on each end.
The beauty of this process is its selectivity. Because the bulky groups forced coupling at only one position, you get essentially pure 4,4′ isomer. After recrystallization (typically from ethanol or acetonitrile), the biphenol is a white crystalline solid with a melting point around 280°C.
So now we have our two monomers. DCDPS, carrying two chlorines. Biphenol, carrying two hydroxyls. Each one precisely engineered for its role. It’s time to put them together.
Part 3: Setting the Stage — The Polymerization Reactor
PPSU is made through solution polycondensation—a type of polymerization where monomers join together at high temperature in a solvent, releasing a small byproduct molecule (in this case, KCl salt) each time a new bond forms. The "condensation" refers to two molecules merging into one while shedding something small, like water droplets condensing on cold glass.
What Goes Into the Reactor
Four components are charged into a jacketed stainless steel vessel equipped with a mechanical stirrer and distillation column:
Solvent: N-methylpyrrolidone (NMP)—a polar aprotic solvent. Polar means it has an uneven charge distribution that helps dissolve other charged molecules; aprotic means it lacks hydrogen atoms that could interfere with the reaction. A Goldilocks solvent: dissolves everything needed but stays chemically inert. Stays liquid to 202°C.
Co-solvent: Toluene—present as an azeotrope former. An azeotrope is a mixture of two liquids that evaporate together at a temperature lower than either would boil alone—like two liquids holding hands and jumping out of the pot together. The toluene/water azeotrope sweeps moisture out of the system via a Dean–Stark trap. Dryness is essential.
Monomers: DCDPS and biphenol, weighed to a molar ratio within 0.995–1.005 equivalents. Even small imbalances limit chain length.
Base: Potassium carbonate (K₂CO₃)—deprotonates the biphenol’s hydroxyl groups to create nucleophilic phenoxide ions. A nucleophile (from the Greek for “nucleus-loving”) is a molecule or ion with extra electrons that seeks to share them by forming a new bond—the mirror image of the electron-hungry electrophile. Here, the negatively charged phenoxide oxygen will be drawn toward the electron-poor carbon on DCDPS.
Part 4: The Reaction — Nucleophilic Aromatic Substitution
The reactor is heated in stages. First to 140–160°C, where the base converts biphenol into di-anionic phenoxide ions (releasing CO₂ and water). The toluene azeotrope sweeps out all moisture over 2–4 hours.
Then the temperature rises to 180–200°C or higher. This is where polymerization begins.
The Molecular Dance
One of the activated phenoxide oxygens approaches a DCDPS molecule, targeting the carbon bonded to chlorine. The sulfone group (–SO₂–) is strongly electron-withdrawing—meaning it pulls electron density away from the surrounding atoms, like a drain pulling water from the edges of a sink. This makes the carbon next to the chlorine electron-deficient and vulnerable. This is nucleophilic attack—the mirror image of the electrophilic attack described in Part 1. There, an electron-hungry molecule latched onto an electron-rich ring. Here, an electron-rich species (the negatively charged phenoxide oxygen) is drawn toward an electron-poor carbon. The oxygen moves in, shares its electrons, and a new bond forms.
The phenoxide oxygen forms a new carbon–oxygen bond—the ether linkage (–C–O–C–) that connects the monomers in PPSU. And here the leaving group concept comes full circle: as the oxygen bonds to the carbon, the chlorine can no longer hold on. Carbon supports only a limited number of bonds, and the incoming oxygen is the stronger partner. The chlorine releases its grip, takes the bonding electrons with it, and departs as a chloride ion—exactly as a leaving group should. It held the position until a better partner arrived, then stepped aside. The displaced chloride pairs with potassium and precipitates as KCl salt.
One bond. One ether linkage formed. One chlorine atom displaced. But each monomer has two reactive sites. After the first bond forms, each end of the growing molecule still has one unreacted site, ready to link to the next monomer in line. And so the chain grows.
Biphenol—ether bond—DCDPS—ether bond—biphenol—ether bond—DCDPS. Each connection displaces another chlorine, produces another molecule of KCl, and adds another repeating unit. The solution becomes increasingly viscous as chains with hundreds or thousands of repeating units tangle and interact. The reaction runs for 4–16 hours at full temperature.
Part 5: Why Water Must Be Removed
This is a step-growth process: every individual end group must find and react with its partner. High molecular weight depends on near-complete conversion.
Water is the enemy. If even small amounts are present, phenoxide ions react with water instead of DCDPS—a hydrolysis side reaction (literally "breaking with water") that kills one end of a growing chain. The toluene/Dean–Stark system removes both adsorbed moisture and water generated by the base’s reaction with biphenol. A few hundred ppm of water can mean the difference between a high-performance polymer and unusable oligomers—short, stubby chains (from the Greek for "few parts") that never grew long enough to develop useful mechanical properties.
Part 6: Controlling the Chain Length
Molecular weight is controlled primarily through stoichiometry—the precise ratio of the two monomers. (Stoichiometry is essentially recipe proportions: measuring exactly how much of each ingredient ensures the reaction comes out right.) A perfectly balanced 1:1 molar ratio drives toward the highest possible molecular weight (the measure of how long and heavy each chain is—longer chains mean better mechanical properties). A deliberate slight excess of one monomer (e.g., 1.005 DCDPS : 1.000 biphenol) caps the chain length—all excess ends terminate with unreacted chlorine, stopping growth at a controlled point.
Chain regulators—monofunctional molecules (molecules with only one reactive group instead of two, like a cap or plug that seals one end of a chain)—offer a second control tool. A monochloro or monophenol end-capper blocks one end of a growing chain from further reaction.
And here is where the story connects to residual chlorine. If DCDPS is in slight excess, or if a monochloro end-capper is used, some chains terminate with an unreacted chlorine atom. That chlorine is chemically bonded to the polymer. It is not an additive. It is the last atom at the end of the line. Together with trace unreacted monomer trapped in the matrix, these account for the residual chlorine detected in destructive testing—completely inert under all normal use conditions.
Part 7: From Reactor to Pellet
When polymerization is complete, the reactor contains viscous PPSU in NMP with KCl precipitated throughout. Converting this into shippable pellets requires several steps:
Filtration: KCl salt is filtered or centrifuged out.
Precipitation: The polymer solution is poured into water or methanol. PPSU crashes out as white fibers or powder; NMP dissolves into the water for later recovery.
Washing and drying: Repeated washes remove residual solvent and salt. Vacuum drying at 120–150°C for several hours.
Pelletizing: Dried powder is melt-extruded at 340–370°C, strand-cooled, and chopped into ~3 mm pellets—the form shipped to customers for injection molding.
Part 8: Why All of This Matters
Every property that makes PPSU irreplaceable in healthcare device housings traces directly back to its molecular architecture:
Sulfone groups (from DCDPS) → heat resistance. Glass transition temperature (Tₗ) of 220°C—the temperature below which the polymer stays rigid and glassy; above it, chains begin to move and the material softens. At 220°C, PPSU stays stiff far above any sterilization temperature. Survives 1,000+ autoclave cycles.
Biphenyl units (from biphenol) → rigidity and toughness. ~690 J/m notched Izod—roughly 10× higher than polysulfone.
Ether linkages (–C–O–C– formed during polymerization) → controlled flexibility. Absorbs impact energy without brittle fracture.
Aromatic rings (from both monomers) → chemical resistance. QUATs, bleach, peroxides, phenolics—PPSU shrugs them off.
Chlorine residuals → inert passengers. Do not leach, migrate, or contribute to flame retardancy. PPSU is inherently UL 94 V-0 from its aromatic sulfone structure alone.
• • •
Conclusion: From Molecules to Mission
If you’ve followed this far, you understand PPSU at a level most people in the industry never reach. You know where the monomers come from. You know how the reaction works. You know why water matters. You know what determines chain length. You know where residual chlorine comes from and why it isn’t a hazard.
That knowledge matters when someone asks why we can’t switch to something cheaper. It matters when a compliance threshold flags a process residual as if it were an intentional additive. It matters when the conversation turns to patient safety.
PPSU is not expensive because it is exotic. It is expensive because every step of its creation demands precision. The monomer synthesis. The purity. The stoichiometry. The water removal. The process control. That precision is what delivers a polymer that protects patients and caregivers in the harshest environments in healthcare. And that is why we stay with Radel.
• • •
Paperwork should not override patient safety.
• • •
Be a driver, not a passenger.
Combating engineering mind blindness, one student at a time.
Joseph P. McFadden Sr.
Engineer • Lifelong Learner • Holistic Analyst
and most important, fellow human
www.McFaddenCAE.com • McFadden@snet.net

Nature of Materials, CAE
Audiobook link → https://www.dropbox.com/scl/fi/82h328u9q9xvqckljwt6e/Materials_in_FEA_-_Part_1.mp3?rlkey=v4onn2dn0et4st8uo8d68fqb4&st=x0gg20zv&dl=0
THE NATURE OF MATERIALS
Part One
Understanding Material Character for Better Simulation
For any finite element tool
Developed in collaboration with Claude (Anthropic)
START HERE.
This is where we begin.
Not with keywords. Not with unit systems. Not with which flags to set in which solver. We begin with the materials themselves — what they actually are, how they behave, what kind of character each one has — and why understanding that character is the foundation of every honest simulation you will ever build.
This audiobook is Part One of two. It applies to every finite element tool ever written — Abaqus, Ansys, Nastran, LS-Dyna, Simcenter, Radioss, any of them. The mathematics differs between solvers. The keywords differ. The material card interface differs. The nature of the material does not differ. Steel is steel in every solver. Polycarbonate is polycarbonate. Glass is glass. And understanding what these materials actually are — not just what numbers describe them — is what determines whether your simulation is a faithful representation of physical reality or an expensive fiction.
Part Two — the technical guide for Abaqus and other solvers — will follow. You can go there next, or you can return to it whenever the need arises. But come here first. Because when you understand the nature of what you are trying to model, the technical requirements in Part Two stop being a checklist and start being an expression of that nature. The density requirement is not bureaucracy. It is capturing presence. The rate-dependent plasticity flag is not a warning box. It is the tool telling you the material's patience changes under different conditions and you have not told it how. Everything in Part Two means more once you have spent time here.
WE UNDERSTAND THINGS BY POKING THEM.
Here is the most fundamental thing I can tell you about simulation, and about engineering, and honestly about understanding anything at all.
We understand things by poking them.
You apply a force — an impact, a vibration, a temperature change, a sustained load — and the system responds. But how it responds depends entirely on what it is. A block of steel responds differently from a rubber pad. A thin glass panel responds differently from a thick aluminum chassis. And the same material responds differently depending on how it was made, what it has been through, and how fast you poke it. The response comes from the nature of the thing. And that nature — that character — is what we are trying to capture when we define a material in a simulation model.
Most FEA training teaches you what to type. Enter Young's modulus here. Enter density here. Add a plasticity curve. Tick the rate-dependent box. But it does not always explain what those numbers mean. What character trait each one expresses. What happens to the simulation's honesty when one of them is wrong — not in a units sense, but in a physical sense. When the number is correct for the test specimen but wrong for the part as it actually exists in the product.
That is what this discussion is about.
MATERIAL SELF-KNOWLEDGE. THE CHARACTER BEHIND THE NUMBERS.
Before a part can interact with anything else in a simulation — before it can push against a floor, load a PCB, transmit force through a bond — it must know itself. And in finite element analysis, self-knowledge means material properties.
Think about the human parallel. A person's response to any situation depends fundamentally on their own nature. Are they resilient or brittle? Do they bend under pressure or snap? Can they absorb energy or do they transfer it instantly to whoever is nearby? Do they behave the same way under gentle pressure as they do under extreme stress? Do they change as they age, as they absorb what the environment gives them, as they carry residual stress from what they have been through?
Every one of these human qualities has a direct material property counterpart. And understanding the correspondence — deeply, not just metaphorically — changes how you approach every material card you ever write.
Young's modulus is confidence.
It determines how much a material resists deformation under load. A high modulus material like steel stands firm. It takes enormous force to change its shape. A low modulus material like rubber yields readily. Neither is better. They simply have different roles in the assembly. Steel is the confident, immovable backbone. Rubber is the adaptable, compliant interface that lets the backbone tolerate misalignment without fracturing something rigid. In an assembly, you need both. The question is whether the modulus value in your model reflects the actual confidence of the material in the actual part. A polymer housing molded with a gate position that created glass fiber alignment perpendicular to the primary load direction can have an effective modulus in that direction 30 to 60 percent or more lower than the isotropic datasheet value. Its confidence in the direction that matters most has been reduced by the very process that created the part.
Poisson's ratio is empathy.
When you compress a material in one direction, it expands in the perpendicular directions. Poisson's ratio quantifies how much a material's response in one axis is affected by what is happening in another. A material with a Poisson's ratio near 0.5 — like rubber — is highly empathetic. Squeeze it here, it bulges there. Every action creates an equal and visible reaction elsewhere. A material like cork, with a Poisson's ratio near zero, is stoic. Compress it and the deformation stays local. It does not transfer its burden outward. This is why cork works for wine bottle stoppers — a highly empathetic material would transmit the seating force to the glass neck and risk cracking it. In FEA, near-incompressible materials approaching a Poisson's ratio of 0.49 or above require special element formulations, because that high empathy creates volumetric coupling that standard displacement elements cannot handle correctly. Note that only exactly 0.5 produces a mathematically singular bulk modulus — values like 0.495 or 0.499 are physically valid and acceptable when used with the appropriate hybrid element formulation. Rubber in standard elements locks up regardless. Its empathy cannot be expressed through conventional displacement interpolation.
Yield strength is patience.
It is the threshold beyond which a material's behavior permanently changes. Below yield, the material is elastic. It springs back. It forgives. Load it, release it, it returns to where it was. Above yield, the material plastically deforms. It remembers the insult. The damage is done. In human terms, everyone has a point beyond which the relationship changes permanently. Knowing where that threshold lies — for both the material and the person — is critical to predicting outcomes. And just as some people become more patient under certain conditions and less under others — calmer in familiar environments, quicker to break under sustained pressure or cold — yield strength changes with temperature, with strain rate, and with the history of what the material has already been through. A material that has been partially yielded carries residual stress and a shifted yield surface. It has already spent some of its patience. It will yield again at a lower additional load than it did the first time if the loading direction changes.
Density is presence.
It determines how much mass occupies a given volume. And in dynamic analysis, mass is everything. A dense part has inertia. It resists acceleration. It dominates vibratory response. In an assembly under impact loading, the densest parts are the heaviest voices in the room — they set the pace of wave propagation, they determine how much of the impacting energy is absorbed locally versus transmitted to neighboring components. A PCB mounted on a magnesium chassis responds differently from the same PCB on a polycarbonate chassis, even with identical geometry and contact conditions, because the chassis presence — its density, its inertia, its mass — is different. When density is wrong in the model, the dynamics are wrong. The voice of that part in the assembly is speaking at the wrong pitch.
THE STRESS-STRAIN CURVE IS THE MATERIAL'S BIOGRAPHY.
The stress-strain curve is not just a graph. It is the biography of the material under load. It tells you where it lives comfortably, where it begins to struggle, when it crosses a point of no return, and how it carries itself under the accumulated weight of what it has been through.
But here is something that is almost never said clearly in FEA training. The stress-strain curve you measure in the laboratory and the stress-strain curve that belongs in your FEA model are not the same curve. They look similar at small strains. They diverge meaningfully at large strains. And understanding why they diverge — and what that divergence means about the material's true nature — is fundamental to honest simulation.
A standard tensile test records engineering stress and engineering strain. Engineering stress is force divided by the original cross-sectional area. Engineering strain is the change in length divided by the original gauge length. These are easy to measure. They are also a polite fiction at large strains. As the specimen stretches, the cross-section shrinks — the material has Poisson contraction, it empathetically redistributes its volume. The actual stress on the material — force divided by the current area — is higher than the engineering stress once meaningful contraction has occurred. The actual strain the material has experienced — accumulated as the natural log of incremental stretch ratios — is also different from the engineering strain. True stress and true strain are what is physically happening to the material. Engineering stress and engineering strain are what the test machine conveniently measures. Your FEA solver works in true stress and true logarithmic strain. Feed it engineering values and you are giving it a biography with the facts changed.
Now the monotonic condition — and I want you to understand this deeply, not just as a rule to follow.
A material has character. Its stress-strain curve expresses that character. And most FEA plasticity models — in every solver — are built on a specific assumption about that character: that the material gets stronger as it deforms plastically. Each increment of plastic strain is accompanied by an increment of true stress. The tangent modulus — the slope of the true stress-true strain curve at any point — is positive. Always. This is the monotonic condition. It is not just a mathematical requirement of the solver. It is a statement about the physical stability of the deforming element. In the framework developed by Drucker, a stable material element releases more energy to its surroundings than it absorbs — it hardens as it deforms. A material that softens — that becomes weaker as it deforms — concentrates deformation rather than spreading it. It forms a band. It localizes. It fails in a way the standard hardening framework was never designed to capture.
For most structural metals, the true stress-strain curve is genuinely monotonically increasing right through necking and up to fracture. The engineering curve shows a descending branch after the ultimate tensile strength — but that is because you are dividing by the original area rather than the shrinking current area. The true stress continues to rise. The material is still hardening. The geometry is softening — the neck is forming — but the material at the neck is not. This distinction between geometric softening and material softening is one of the most important in all of structural mechanics. If you enter the engineering stress-strain curve directly into your plasticity model without converting to true values, the descending post-ultimate branch violates the monotonic condition, and the solver either flags it or silently misbehaves at strains beyond that point. The material's biography has been mistranslated. The solver is reading fiction as fact.
Polymers are more complex and more physically interesting. Many semicrystalline thermoplastics — nylon, polypropylene, polyethylene — show a pronounced upper yield point. At that point, the crystalline structure begins to break down. The polymer chains start to disentangle from their ordered arrangement. And the material genuinely, physically softens — the true stress drops as plastic strain increases through that transition zone. This is not a measurement artefact. It is the material's character changing. It is patience running out in a particular way — not a sudden brittle snap, but a deliberate yielding of structure followed by a new equilibrium: cold drawing. In cold drawing, uncoiled chains align in the loading direction, and a long plateau of large plastic strain at nearly constant stress carries the material to fracture. The descending branch from upper yield to lower yield plateau violates the monotonic condition in any standard isotropic hardening model. The standard approach is to regularize: replace the descending branch with a horizontal step directly from the upper yield point to the lower yield plateau. Understand what you are doing when you regularize. You are not modelling the strain-softening instability that drives shear band formation in the real material. For most engineering drop test applications where you need total energy absorption and peak force, the regularized curve is adequate. For analyses where localization and shear banding are the actual failure mechanism, it is not — and you need constitutive models with damage mechanics and regularization length-scale parameters.
One more implication worth stating clearly: extrapolation. Your plasticity data ends at the last test point — the strain at fracture in the tensile test. In an explicit dynamic simulation, local strains at impact zones and stress concentrations can exceed that test strain. The solver extrapolates — extending the last tangent slope forward into territory the test never covered. Check the maximum plastic strain in your results against the maximum strain in your input data. If elements are operating beyond your data range, the extrapolated response is an assumption. Own it. Document it. Do not let it hide.
THE NATURE OF EACH MATERIAL FAMILY.
Let us walk through each material family and ask not what the numbers are, but what the material's nature is. What kind of character are we trying to capture? And what does that character demand from the model?
Metals — the confident, history-carrying materials.
Metals are confident — high Young's modulus, high yield strength. They resist deformation strongly and yield only after sustained effort. But metals carry their history. A metal that has been cold-formed remembers the plastic strain it absorbed during forming as a shifted yield surface and a hardened microstructure. A metal that has been welded carries a heat-affected zone where its confidence has been locally reduced by thermal annealing. A die-cast metal carries porosity from its birth in the mould — microscopic voids that reduce ductility and fatigue patience without changing the nominal yield stress. The character of a metal is inseparable from its manufacturing biography. The alloy name tells you the chemistry. The temper designation tells you the current state of the character given that chemistry. The manufacturing process tells you what local deviations from that character exist in the real part. Metals are also rate-sensitive in a way that reflects their atomic-scale deformation mechanisms. At higher loading rates, dislocations have less time to move and multiply. The material resists more. Its patience under rapid loading is higher — it becomes temporarily more confident under pressure. This rate sensitivity is not a peculiarity to be corrected for. It is the material's natural response to being poked quickly. Capture it and the model reflects the real character. Ignore it and the model describes a metal that is the same in a crash test as in a slow-speed press — which it is not.
Polymers — the rate-sensitive, moisture-absorbing, history-dependent materials.
Polymers are deeply sensitive to conditions in a way that no metal is. Their confidence changes by a factor of two or more with moisture content. Their patience changes with temperature and rate in ways that can shift the failure mode entirely — from ductile cold drawing to brittle fracture — as a function of how fast you load them or how cold the environment is. Their history — weld lines from injection moulding, fibre orientation from the flow pattern, residual stress from differential cooling — can reduce their strength at specific locations by 30 to 70 percent without any change in the bulk material numbers. A polymer is the most context-dependent structural material in common use. Its character in the finished part is a product of the material's chemistry, the mould designer's decisions, the process engineer's settings, and the environment the product will live in. The datasheet captures the chemistry in a standard specimen under standard conditions. The other factors are invisible in the datasheet. They must be known by the analyst. The upper yield point and cold drawing of semicrystalline polymers is one of the most physically interesting phenomena in structural materials — a genuine phase transition under mechanical stress, the crystalline order breaking down and chains realigning in a lower-energy configuration. Standard FEA plasticity assumes the material's mechanism does not change. Here it does. Regularizing the data is the engineering workaround. Understanding why you are regularizing is the difference between applying a rule and understanding the physics.
Glass — the patient accumulator that fails without warning, always at its weakest point.
On the macroscopic scale that matters for engineering simulation and drop testing, glass does not yield. It remains linear elastic right up to fracture. There is no plastic deformation, no cold drawing, no forgiveness once the critical stress is reached. This is glass's defining character: enormous confidence paired with zero macroscopic ductility.
But I want to be careful here, because I do not promote black boxes and a simplification should be understood as a simplification. At the atomic scale, all materials yield to some degree. Even glass experiences localized bond breaking and rearrangement at crack tips. Glass technically flows over very long timescales — it is a supercooled liquid, and old cathedral windows are sometimes thicker at the bottom because of centuries of slow viscous movement. The difference between glass and a ductile metal is not that glass is incapable of any irreversible atomic rearrangement. The difference is that in glass these microscopic processes do not produce meaningful plastic flow before catastrophic failure at engineering timescales and temperatures. The material does not spread the damage — it concentrates it. One flaw under sufficient tension becomes a running crack before any other region has time to redistribute load plastically. For engineering simulation, we model glass as linear elastic to fracture — and that is the correct approximation. But know that it is an approximation, and know why it is valid.
This brings us to glass's deepest truth: it fails at its weakest link. The fracture strength of a glass panel is not determined by the average strength of the material. It is determined by the severity of the worst surface flaw present under tension at the moment of loading. A pristine chemically strengthened panel may withstand 700 to 800 megapascals. The same panel with a single five-micron scratch from a key in your pocket may fail at 150 to 200 megapascals. Not because the material changed chemically. Because the flaw changed the local stress intensity — the crack tip stress relative to the material's fracture toughness. This is the Griffith criterion, and it means that glass strength is inherently statistical. The same panel, the same load, different surface histories — different outcomes. This enormous variability is why glass strength follows Weibull statistics rather than a single deterministic value. The surface history — invisible scratches, handling marks, manufacturing imperfections — writes the final chapter of the glass's patience. Chemically strengthened glass adds a powerful defense: the ion-exchange process creates deep surface compression of 700 to 900 megapascals. The glass spends patience in advance so that external tension must first overcome that built-in compression before the surface goes into net tension. Modelling glass as linear elastic with a fixed fracture strength is honest only if you remember that the real strength lives in the flaws and the surface history, not in the bulk material alone.
Elastomers — the empathetic, compliant adaptors.
Elastomers have low confidence, enormous empathy approaching the incompressible limit, and extraordinary patience — they stretch to several times their original length and return to the original state. Their patience is energetic, not structural: stored strain energy, not plastic deformation. The stress-strain biography of an elastomer is a curve — nonlinear from the start, stiffening at large strains as the polymer chains approach full extension. There is no yield point in the traditional sense because the deformation is always recoverable until rupture. The hyperelastic model is not an approximation of elastomer behaviour — it is the mathematically correct description of it. Strain energy density as the fundamental quantity, stress derived from it. Any other approach is using the wrong language to describe the material's character.
Foam — the compressible, absorbing, rate-sensitive cushion.
Foam's character is defined by its architecture as much as its constituent material. The three-regime stress-strain biography — gentle elastic cell bending, the long energy-absorbing plateau of cell buckling and collapse, the stiffening densification as collapsed cells contact each other — is the story of that architecture progressing through three distinct mechanical states. A FEA model that uses a linear elastic material for foam is saying the architecture never changes under load. It is wrong by design. The plateau regime is where foam does its work in a drop test — absorbing energy at nearly constant force, protecting what is behind it. Miss the plateau, miss the engineering purpose of the foam.
RATE AND TEMPERATURE. WHEN CHARACTER CHANGES.
We said yield strength is patience. But patience is not fixed. A person who is normally patient can lose patience under sustained pressure, in extreme cold, or when events happen faster than they can process. Materials behave the same way.
Rate changes character. Metals poked quickly are more confident and more patient — higher modulus and higher yield. Polymers poked quickly become more confident but less patient in ductile terms — they may switch from cold drawing to brittle fracture. The same polycarbonate that absorbs enormous energy at slow rates can fracture without meaningful yield at very high impact rates. Its character has not changed permanently — put it back at slow rates and it is ductile again. But in the moment of the drop test, its character is different from what the datasheet describes at quasi-static rates. The model must reflect the character the material actually has at the rate of the event. Rate and temperature effects can also change the monotonic character of the stress-strain response qualitatively, not just quantitatively. A polymer that is monotonically hardening at low rates may show a pronounced upper yield drop at high rates. A metal that is monotonically hardening at room temperature may show thermal softening and localization at very high rates where adiabatic heating is significant. These are not just quantitative shifts in parameter values. They are qualitative changes in the nature of the material's response — changes that require different constitutive frameworks, not just different numbers.
Temperature for polymers defines the boundary between two entirely different materials in terms of behaviour. Above the glass transition temperature, the chains are mobile — soft, creep-dominated, easily deformed. Below it, the chains are frozen — rigid, brittle at stress concentrations, sensitive to notches and rate. The same polycarbonate housing that is tough and impact-absorbing at 23 degrees Celsius can fracture in a brittle manner at minus 40 degrees — not because the material changed chemically, but because the temperature crossed the threshold where its molecular mobility changed. Moisture for hygroscopic polymers acts as a plasticizer — it lowers the effective glass transition temperature, increases chain mobility, increases ductility, and reduces both modulus and yield strength. In every case the question is the same: what is the character of this material at the conditions of the event you are simulating?
THE THREE QUESTIONS.
Before accepting any material card, ask three questions.
Where did this property come from? We are asking: does this number describe the character of the material in this part, or the character of a carefully prepared laboratory specimen under carefully controlled conditions? The property came from somewhere — a test, a datasheet, a literature value, an assumption. Each source has a scope and a set of conditions. The question is whether that scope matches the part.
What process created the part? We are asking: what has this material been through since it was in its standard datasheet condition? A die-casting process gave it porosity. An injection molding process gave it weld lines and fibre orientation and residual stress. A heat treatment changed its temper and its patience. A welding process locally annealed it. An ion exchange process pre-loaded its surface in compression. The manufacturing biography of the part is written into its material character — whether or not the FEA model acknowledges it.
What environment will it see? We are asking: at what rate will this material be loaded, at what temperature, in what moisture state, after how much service life? The material's character at the moment of the event is determined by all of these. A material model that uses the room-temperature, quasi-static, dry-as-molded datasheet value for a part that will be dropped at minus 40 degrees after two years of humidity exposure is not describing the same material. It is describing a different material that happens to have the same name.
The Holistic Analyst asks all three questions — not because a checklist demands it, but because the simulation is a representation of reality, and reality includes the full character of the material. Every property you enter is a claim about reality. The question is whether that claim is honest.
CLOSING. THE HONEST SIMULATION AND THE TESTING MINDSET.
A simulation with carefully considered, clearly documented material assumptions is honest engineering. It tells the reviewer: here is what I know, here is what I assumed, here is where I have uncertainty, and here is the basis for the confidence I am claiming. A simulation with default, unexamined material values is not honest engineering. It may produce numbers. It may even produce numbers that pass a safety factor. But those numbers are a claim about a reality that was never examined.
When you poke a system in simulation, the response you get back is determined by the character you gave it. If you gave it the wrong character — wrong density, wrong yield strength, wrong rate sensitivity, wrong surface condition, wrong manufacturing history — the response is not the response of your part. It is the response of a fictional part that happens to have the right shape.
Let me share two approaches I use in my own work, because they illustrate what the holistic analyst mindset looks like in practice.
The first is a homemade stress relaxation device. I bend a plastic bar and hold it at a fixed strain while recording the change in relaxation force over time. When I want to evaluate the effect of a chemical on the material under realistic service conditions, I apply the chemical to the outer face — which is in tension — so it gets absorbed exactly where the stress is highest. This picks up the effect of chemical exposure much faster than standard ASTM methods that test the material unstressed. I can control the strain level, which means I can calibrate viscoelastic Prony series parameters from the relaxation curves and use them in simulation. I have used this approach successfully to model stress relaxation in plastic triggers where long-term force retention was the critical design variable. The key insight is that you are not using generic datasheet viscoelastic properties. You are using properties measured on material in a condition that reflects what the part actually experiences.
The second is a homemade impact bending tester. I load a dogbone specimen on its edge — one-eighth inch thick face taking the impact — with a soft notch of one-eighth inch radius on the opposite face from the impact point. The impactor drops from a controlled height in free fall, so I can directly control the impact velocity. I measure the impact force over time. And I film the yield and fracture sequence with a high-speed camera at approximately 6400 frames per second. Then I run the same experiment in FEA. I simulate the impactor dropping from the same height, the same specimen geometry, the same notch, and I compare the simulated force-time history to the measured one — and the simulated deformation and fracture sequence to the high-speed camera footage. When those two match — the force history and the visible fracture timing — I have reverse-engineered the material's rate-dependent plastic behavior and damage properties from an experiment that directly replicates the loading mode of the real product. Not a generic uniaxial tension test. A bending impact test designed for the way the part actually breaks.
When you can match the force-time history and the visible fracture behavior simultaneously, you have moved well beyond datasheet modelling. You have demonstrated that the material card in your model describes a material that behaves the way your real material behaves, at the rates that matter, in the failure mode that matters. That is not a black box. That is an honest simulation.
Understanding material nature — deeply, not just numerically — is what makes this level of validation possible. Young's modulus is confidence. Poisson's ratio is empathy. Yield strength is patience. Density is presence. Behind every number on a material card is a physical reality — a character — that your model is trying to faithfully represent. The better you understand that character, the more faithful the representation. The more faithful the representation, the more honest the simulation. And the more honest the simulation, the more trustworthy the engineering decision it supports.
That is the Holistic Analyst. That is what combating engineering mind blindness actually means.
When you are ready for the technical guide — the keywords, the unit systems, the solver checks, the rate-dependent flags, the Abaqus INP Analyzer workflow — that is Part Two. It will mean something different now.
Technical Reference
Link to Audiobooks
Part 5 Tech reference → https://www.dropbox.com/scl/fi/8p4ohg6529wpozy0orjph/Advanced_Glass_Discusion_Part_5_Tech_Tables_McFadden_16July2026.mp3?rlkey=p379yf2aozn91ludmi6ykadm2&st=q2f802qh&dl=0
Technical Reference Companion
Reader Edition — Advanced Glass Technology for Handheld and Industrial Devices
Joseph McFadden — McFaddenCAE.com — v8, July 2026
Scope and How to Use These Values
This companion collects the working numbers and governing relations from the audiobook series in technical format — digits, symbols, and equations rather than narration. Every value is a test-specific starting point measured under particular conditions: manufacturer datasheet values reflect the supplier's specimens, geometry, and surface condition; literature values reflect the cited environments. Nothing here is a universal constant. The intended workflow is the one the series teaches: use these values to reason, to screen, and to catch order-of-magnitude errors — then calibrate against your own parts, your own process, and your own environments before certifying anything.
Where the audio narration and this document state the same quantity, the numbers are identical; this edition simply restores digits, units, and symbolic form.
Notation
Symbol
Meaning
Symbol
Meaning
σ: Applied (far-field) tensile stress
KIC: Fracture toughness (Mode 1 critical value)
a: Crack (flaw) depth or half-length
G: Strain-energy release rate
Y: Geometry factor (≈ 1.12 for edge cracks)
γf: Fracture surface energy (per surface)
KI: Mode 1 stress-intensity factor
E, ν: Young's modulus, Poisson's ratio
Pf: Cumulative probability of failure
v, n, A: Crack velocity; stress-corrosion exponent; SCCG coefficient
σ0: Weibull characteristic strength (63.2%)
CS, DOL, CT: Surface compressive stress; depth of layer; central tension
m: Weibull modulus (scatter parameter)
rm, Am: Mirror radius; mirror constant
Governing Relations
Stress intensity at a flaw under Mode I (opening) load:
KI = Yσ √(πa) (1)
Fast fracture criterion:
KI ≥ KIC (2)
Energy form (Griffith/Irwin). Plane stress E′ = E; plane strain E′ = E/(1 − ν²). Critical value Gᴄ = 2γf for ideally brittle fracture:
G = KI2 / E′ (3)
Weibull cumulative probability of failure (two-parameter):
Pf(σ) = 1 − exp[ −(σ/σ0)m ] (4)
Design strength at 90% reliability (B10):
B10 = σ0 (−ln 0.9)1/m (5)
For m = 5, B10 ≈ 0.45 σ0; for m = 20, B10 ≈ 0.80 σ0. Datasheet mean strength (≈50% failure probability) is dangerously non-conservative as a design criterion.
Subcritical (fluid-mediated) crack growth, Region I power law:
v = da/dt = AKIn (6)
Thermally activated form (reaction-rate control; explains climate sensitivity — rate roughly doubles per 10–15 °C within the service range):
v = v0 exp[ (−Ea + bKI) / RT ] (7)
Time to failure under sustained stress σ, integrating Eq. 6 from initial flaw aᵢ (valid for n ≫ 2; the result is dominated by the initial stress intensity):
tf ≈ 2 KIi2−n / [ (n − 2) AY2 π σ2 ] (8)
Fracture-surface (mirror) relation — failure stress from mirror radius; the mirror constant is composition-specific and must be calibrated:
σf √rm = Am (9)
Interpretation discipline from the series: a large mirror alone establishes only that failure stress was low. Slow-growth conclusions require the combination — mirror size, arrest lines where present, surface and edge condition, and service history.
Table 1 — Key Material Properties
Glass
E (GPa)
K₁c / hardness
Strengthening (CS / DOL)
Notes
Corning EAGLE XG (substrate): E 73–74 GPa *** not chemically strengthened
ρ 2.38 g/cm³; strain point ≈ 669 °C; CTE ≈ 3.17 ppm/°C; display substrate (CF/TFT)
Corning Gorilla Glass Victus 2: E 79 K₁c 0.82 MPa·√m; HV 670
high CS, deep DOL (datasheet)
static bend strength 600–700 MPa; dynamic (impact) 800–1000 MPa
SCHOTT Xensation Up: E 82 GPa
CS > 900 MPa; DOL > 150 µm
ν 0.22; ρ 2.48 g/cm³; LAS composition
SCHOTT Xensation Alpha: E 80 GPa
deep-strengthened
ν 0.26; ρ 2.39 g/cm³; LABS composition; +100% drop vs. LAS on rough surfaces (maker test)
AGC Dragontrail (production ending Q3 2026): E 74 GPa. HV 673
CS > 600 MPa; DOL 35–45 µm
listed for legacy fleets and historical comparison; AGC exiting the business
Maker performance claims (e.g., drop-height survivals) are system results from specific test protocols — surface, dummy mass, and mounting all matter — not material properties.
Table 2 — Critical Strain Thresholds (screening values, quasi-static baseline)
Glass condition
Surface strain
Edge strain
Basis
Chemically strengthened aluminosilicate / LAS
0.3–0.5%
0.1–0.3%
quasi-static, ambient
Non-strengthened aluminosilicate / borosilicate
0.1–0.2%
0.05–0.1%
quasi-static, ambient
Adjustment
Factor
When applied
Dynamic (drop / impact)
+20 to +50%
strain rates ≈ 10²–10⁴ s⁻¹; subcritical growth outrun
Long-duration / environmental
−20 to −50%
sustained load or cyclic-environmental service; fluid-mediated growth active
Edge thresholds are roughly half the surface values because cutting flaws (20–100 µm) exceed surface flaws (1–10 µm) and K₁ scales with √a. A single uniform failure criterion across a glass model is non-conservative; treat edges as a distinct region. These are screening values — calibrate to your flaw population, edge finish, stressed area, rate, and environment before design use.
Table 3 — Subcritical Crack Growth Parameters (50% RH, 25 °C, soda-lime/aluminosilicate class)
Parameter
Value
Units / note
Stress corrosion exponent n
≈ 15–20
dimensionless; environment-dependent
SCCG coefficient A
10⁻⁵–10⁻⁴
m/s · (MPa·√m)⁻ⁿ
Fracture toughness K₁c
≈ 0.75 (0.70–0.85)
MPa·√m, typical cover-glass class
Region I (reaction-rate limited)
K₁ ≲ 0.25
MPa·√m; water-reaction controlled; climate-sensitive
Region II (transport-limited plateau)
K₁ ≈ 0.3–0.5
MPa·√m; water-delivery controlled
Region III (mechanically dominated)
K₁ ≳ 0.55 → K₁c
MPa·√m; environment-insensitive
Table 4 — Crack Propagation Velocity Limits and Fractographic Transitions
Quantity
Value
Note
Rayleigh wave speed, silicate glass
≈ 3000–3600 m/s
theoretical ceiling for Mode I
Terminal crack velocity (phonon / elastic-wave limited)
≈ 30–60% of Rayleigh ≈ 1500–2200 m/s
typical aluminosilicate compositions
Mirror → mist transition
≈ 0.3 × terminal velocity
onset of tip instability
Mist → hackle transition
≈ 0.5–0.6 × terminal velocity
energy shed to roughening
Bifurcation onset
> 0.6 × terminal velocity
crack branching; chaotic fracture
Table 5 — Environmental Effects on Effective Strength
Condition
Effect on strength
Mechanism
High strain rate (drop impact)
+20 to +50%
load applied faster than subcritical growth can act
−20 °C
−10 to −20%
glass-level embrittlement; note assembly effects often dominate (stiffened constraints)
+50 °C
+5 to +10%
minor viscoelastic energy dissipation
Humidity, long-term static load
−20 to −50%
fluid-mediated stress corrosion (Region I integration over time)
Aggressive cleaning (alkaline pH > 10; extended IPA)
additional −10 to −20%
accelerated subcritical growth; network attack (alkaline); oleophobic coating loss
Saline / sea-spray exposure
additional −10 to −20%
chloride-accelerated silica attack; partial surface ion-exchange reversal
Effects compound along a service history: the same part can carry a dynamic bonus during the drop and an environmental deficit accumulated before it. Temperature is a system variable — the constraint stiffness of adhesives and gaskets changes more over the service range than the glass does, redirecting how much of an event's energy arrives in the glass as tension.
Closing Note
For the reasoning behind every number in this companion — and the reasons to hold each one loosely — the four parts of the series are where the story lives. Questions and discussion are welcome: mcfadden@snet.net · McFaddenCAE.com.

All Roads lead back to Energy
Link to audiobook → https://www.dropbox.com/scl/fi/c5uj43x17asfqillyo4g8/July3rd_Threes_company_EMFC_Audiobook_script_2026.mp3?rlkey=o6n6saf8y44tfcur2d6gzux56&st=ksbkd5mx&dl=0
How Fluids Kill Polymers: The Energy-Mediated Fluid Cracking Story
An Audiobook Conversation
Joseph P. McFadden Sr.
July 3rd, 2026
Contents
Preface.................................................................. 4
Introduction: The Mystery of Energy-Mediated Fluid Cracking.................................... 5
Part One: Griffith’s Gift—Understanding Fracture Through Energy................................. 10
The Paradox That Started It All................... 10
The Energy Balance Insight.......................... 10
The Criterion for Crack Growth................... 11
From Cracks to Crazes.................................. 12
The Nature of Surfaces.................................. 12
What Happens When Fluid Replaces Air... 13
The Two Factors That Matter....................... 13
Some Quantitative Examples....................... 15
The Initiation threshold drops.................... 16
No Surface Is Perfect..................................... 16
Crack Growth Accelerates............................ 18
The Positive Feedback Loop........................ 20
Your Insight: Depth and Length.................. 21
The Wet Storage Paradox............................. 22
The Time Scales Matter................................. 25
The Role of Stress Relaxation...................... 26
The Swelling Effect........................................ 27
Standard Tests May Mislead........................ 27
The Value of Forensic Testing..................... 28
Design Strategies That Work....................... 28
Service and Maintenance Matters.............. 30
Effects on Craze Fibrils................................. 31
Molecular Mobility Effects............................ 31
The Concentration Evolution Effect........... 32
Part Eight: Some Final Thoughts on Thermodynamics and Failure......................... 32
Thermodynamics Ultimately Governs....... 33
Scale Connections Matter............................. 33
Materials Communicate............................... 33
The Value of Field Observations................. 34
Conclusion: The Story Surface Energy Tells. 34
Preface
Hi, my name is Joe McFadden. I’ve spent more than forty years as an engineer, educator, and investigator of failures. I’m offering this content to you, not as a textbook, but as a conversation—with failure itself, with history, and with lived experiences.
Based upon my lived experiences, I found that many failures, across many industries, were the result of the failure to incorporate a holistic approach during development.
Let me share the why behind this particular telling. Over the years, the more I’ve chased the why of things—why parts fail, why people do what they do, why the world works the way it does—the more I’ve found that every path leads back to the same place. Energy.
And not energy as some abstract idea, but something more specific: how everything stores energy, moves and manipulates it, and ultimately lets it go—how it dissipates. That thread runs through all of it. It’s how life evolved. It’s how we think—how our minds take in and process information. It’s how we act, how we live, and, in the end, how we pass. It’s the lived experience of you and me. It’s the lived experience of our ancestors, carried forward into us. And it’s every bit as true for the materials we choose and the systems we build—they answer to the same imperative we do.
Consider life itself. One of the most compelling theories of how life arose and grew more complex isn’t really about survival or replication at all—it’s about dissipation. The thinking runs from Schrödinger, yes the cat guy, Schrödinger’s question of what life is, through the work of Ilya Prigogine—the Belgian chemist who earned a Nobel Prize for showing how ordered structures can arise spontaneously in systems held far from equilibrium—and on into more recent thermodynamics. The idea is that complex, living systems may emerge precisely because they are so good at taking in energy and dissipating it, at hurrying the flow of energy from concentrated to spread-out. Life, in this view, is one of the universe’s most elegant ways of dissipating energy.
I’m actually in the middle of this right now. After getting pulled into the idea of dissipative systems—and Prigogine’s work, along with others—I picked up a book called Into the Cool: Energy Flow, Thermodynamics, and Life, by Eric Schneider and Dorion Sagan. Their argument is that the universe is relentlessly driven to break down gradients—differences in the concentration of energy—and that life is one of nature’s most effective ways of doing exactly that. Reading it has only deepened my conviction that this story, too, is at heart a story about energy.
And here’s the most beautiful irony of all. For something so fundamental—something that shapes how we evolved, how we think, how we live and how we pass—we still cannot say what energy actually is. Richard Feynman pointed this out plainly: in all of physics, we have no real definition of what energy is. We know how to count it, measure it, and track it as it changes form, and we know that it’s always conserved. But what it is, at bottom, we do not know. We understand energy entirely by what it does, never by what it is. So all roads lead back to energy. And energy is the one thing we still can’t say we understand.
So I went back to my earlier work on this subject—work that had already brushed up against this idea—and I felt it was time to tell the story properly, through the lens of energy: how it’s stored, how it’s moved, and how it’s let go. Because once you see that everything bends toward energy and its dissipation, what we call environmental stress cracking stops looking like a strange exception and starts looking like one more expression of the rule.
This brings me to today’s discussion, of compatibility of plastic components in the real world.
Ok, let’s start.
Introduction: The Mystery of Energy-Mediated Fluid Cracking
Hello. Joe McFadden here. Welcome to what I’m calling my “holistic audiobook” on one of the most fascinating, most frustrating, and most misunderstood failure modes in polymer engineering.
A failure mode we traditionally call environmental stress cracking, or ESC. But we’re going to talk about why I think we need a new name—Energy-Mediated Fluid Cracking, or EMFC for short—and why the old name actually obscures what’s really happening. We’re going to understand this phenomenon at a deep level, centering the energy, the thermodynamics, and the molecular interactions that make fluids such deadly agents for polymers.
Picture this: You’ve got a polyethylene storage tank. It’s been holding water under pressure for five years. No problems. The stress analysis shows it’s well within safe limits. The material is chemically resistant to water. Everything should be fine.
Then someone fills it with a detergent solution. Not a strong acid, not a solvent that dissolves polyethylene, just a mild detergent. And within 48 hours, the tank cracks. Catastrophically. Thousands of gallons of fluid on the floor.
Or this: A polycarbonate component in a medical device. Carefully designed, thoroughly tested, performing beautifully in service. Then a technician wipes it with isopropanol during routine cleaning—a procedure that’s been done hundreds of times. And it cracks. Right there, right then. An audible snap, a visible fracture, sudden failure.
What’s going on? The stress didn’t change. The detergent doesn’t dissolve polyethylene. The alcohol doesn’t dissolve polycarbonate. So why do these materials suddenly fail when they contact these fluids?
The answer lies in understanding something fundamental about cracks: they’re not just geometric features, they’re surfaces. And surfaces have energy. And fluids can change that energy. And when they do, they change everything about how cracks grow.
This is the story of energy-mediated fluid cracking through the lens of surface energy and thermodynamics. We’re going to understand why certain fluids cause catastrophic failures, why the specific polymer-fluid pair matters so much, and—here’s where it gets really interesting—why the way you apply the fluid matters as much as what the fluid is.
Because I’m going to share some field observations that reveal complexities you won’t find in textbooks. Things like: why wiping a part with solvent can be more damaging than immersing it. Why repeated brief exposures can be worse than continuous long exposure. Why sometimes heating a part while keeping it wet actually protects it from damage.
These aren’t paradoxes—they’re thermodynamics and kinetics playing out in ways that surprise us if we’re not thinking carefully about what’s really happening.
So let’s dive in. We’re going to talk about Griffith and energy balances, about surface energy and why it matters, about capillary action and fluid penetration, and about some real-world forensic work that reveals how complex this behavior really is.
By the end, you’re going to understand energy-mediated fluid cracking not as some mysterious material defect but as a predictable consequence of thermodynamic principles. And once you understand it, you can design against it, test for it, and prevent it.
Let’s start with why we need a new name for this phenomenon.
Why We Need a New Name: From ESC to EMFC
Okay, so first things first. Why am I calling this “Energy-Mediated Fluid Cracking” instead of the traditional “environmental stress cracking”?
It’s not just semantics. Names matter. The terminology we use shapes how we think about problems. And I’ve come to believe that “environmental stress cracking” is actually a problematic name that obscures the fundamental physics.
First, “environmental” is vague. What does it even mean? The ambient environment? Temperature and humidity? Chemical exposure? All of the above?
In practice, what we’re really talking about is fluid exposure. Specific liquids or sometimes vapors coming into contact with the polymer. Not just “the environment” broadly, but particular chemical species that interact with the polymer in specific ways.
Water is an environment. Air is an environment. But water causes this failure mode in nylon while doing almost nothing to polyethylene. Air generally doesn’t cause it at all. So “environmental” is too broad, too nonspecific.
If we say “fluid cracking,” we’re immediately more precise. We’re pointing attention to the right place: which fluids, which polymers, what’s the interaction?
Second, we’ve got “stress” appearing twice—once explicitly in “stress cracking” and implicitly in the fact that we’re talking about stressed components. But here’s the thing: stress is necessary but it’s not the primary variable that changes.
Think about it. You’ve got a component under stress. It’s carrying load. Let’s say twenty megapascals—a nice moderate stress level, well within the design limits, nothing dramatic. And this component sits there in air for years. No problem. The stress hasn’t caused failure.
Now that same component, same stress level, contacts a particular fluid. And within hours or days, it cracks. Catastrophically.
What changed? The stress didn’t change. It’s still twenty megapascals. The mechanical loading situation is identical.
What changed is the energy landscape. The thermodynamic balance that determines whether crack growth is favorable or not. And that change was mediated by the fluid.
So emphasizing “stress” twice in the name kind of misses the point. Yes, stress is necessary—you need tensile stress to drive crack opening. But stress alone wasn’t causing failure. The fluid fundamentally altered what stress level is safe versus dangerous.
Third, and this is the big one: the traditional name tells us nothing about the mechanism. It’s purely descriptive. “Under stress, in an environment, cracking happens.” Okay, but why? What’s the physical process?
Compare this to other well-named phenomena. “Stress corrosion cracking”—okay, corrosion is the mechanism, it’s an electrochemical process, we know what’s happening. “Hydrogen embrittlement”—hydrogen is entering the material and affecting crack growth, mechanism identified.
But “environmental stress cracking”? It just describes the conditions—stress plus environment—without explaining the causation. It’s like naming a disease “sick person syndrome.” Descriptive but not explanatory.
So here’s what I’m proposing: Energy-Mediated Fluid Cracking. EMFC for short.
“Energy-Mediated” puts the mechanism front and center. This is about energy. Specifically, it’s about how fluids alter the energy balance that governs fracture. They reduce the energy cost of creating crack surfaces, which shifts the thermodynamic equilibrium toward crack growth. Energy is the lens through which we understand this phenomenon.
When you hear “energy-mediated,” you’re immediately thinking thermodynamics. You’re thinking energy balance, energy barriers, energy landscapes. That’s exactly the right mental framework.
“Fluid” specifies the agent. Not “environment” vaguely, but fluids specifically. This directs attention to the critical question: which fluids interact with which polymers to create the energy change we’re talking about?
“Cracking” is the outcome. We’re talking about crack propagation, fracture, material separation. Clear and specific.
So: Energy-Mediated Fluid Cracking. The mechanism, the agent, the result. All in the name.
Why this matters: the name shapes how we think about the problem. If we call it “stress cracking,” we focus on stress reduction. And yes, reducing stress helps—I’m not saying it doesn’t. But we might miss that material selection based on surface energy properties is equally important. We might miss that the specific fluid matters enormously.
If we call it “environmental” cracking, we might think broadly about “harsh environments” rather than specifically about molecular interactions between fluids and polymers.
But if we call it “energy-mediated fluid cracking,” we’re immediately asking the right questions:
• What’s the surface energy of this polymer?
• How much does this fluid reduce that surface energy?
• What’s the energy balance—is crack growth favorable?
• Can we modify the energy landscape through material choice, coatings, barriers?
The name guides the thinking. The thinking guides the solution.
So throughout this audiobook, I’m going to use EMFC when I’m talking about the phenomenon mechanistically. I’ll still say ESC when I’m referencing historical literature or established test standards—we can’t just ignore decades of accumulated knowledge. But conceptually, we’re thinking EMFC.
Energy-mediated. That’s the key. The fluids are mediating an energy change that enables crack growth.
Okay, with that established, let’s build the foundation. Let’s talk about Griffith.
Part One: Griffith’s Gift—Understanding Fracture Through Energy
The Paradox That Started It All
In the early 1920s, there was a problem. A big problem. Engineers could calculate, from basic atomic bond strengths, how strong materials should be. The theoretical strength—the stress required to literally rip atoms apart—was enormous. Materials should be incredibly strong.
But they weren’t. Glass, in particular, was failing at stresses sometimes 100 times lower than theoretical strength predicted. A hundred times! That’s not a rounding error. That’s a fundamental disconnect between theory and reality.
Allan Griffith, working on this problem, had a crucial insight. He realized that everyone was asking the wrong question. They were asking “how much stress does it take to break bonds?” But Griffith asked a different question: “What’s the energy balance during crack formation?”
The Energy Balance Insight
Here’s Griffith’s logic, and it’s beautiful in its simplicity.
When a crack forms, or when an existing crack grows, two things happen energetically.
First, you create surfaces. A crack has two faces—upper and lower. Those faces are new surfaces that didn’t exist before. Creating surfaces requires energy. Why? Because molecules at a surface are in a higher energy state than molecules in the bulk. They’re missing neighbors on one side. They have unsatisfied bonds, unsatisfied molecular interactions. That costs energy.
We call that energy cost “surface energy,” denoted by the Greek letter gamma (γ). It’s measured in energy per unit area—something like millijoules per square meter. Every material has a characteristic surface energy. For polymers, it’s typically thirty to fifty millijoules per square meter.
So if you extend a crack by a little bit—call it da—you create new surface area. For a crack of unit thickness, you’re creating two times da of new surface on each face, times two faces, so four times da total. The energy required is four γ times da.
Second, you release strain energy. The material around a crack is under stress. That stress stores elastic energy, like a compressed spring stores energy. When the crack extends, material that was previously loaded becomes unloaded—it’s now inside the crack, stress-free. The strain energy that was stored in that material is released.
For a crack in a very wide plate under stress σ, the strain energy released when the crack extends by da is (πσ²a / E) · da—where E is the elastic modulus and a is the crack half-length.
The Criterion for Crack Growth
Griffith said: the crack grows when the energy released equals or exceeds the energy required. When the strain energy you get back is enough to pay for creating the new surfaces.
This gives you a critical stress:
Griffith critical-stress criterion
Look at what this equation tells us. Three profound insights:
One: Fracture stress depends on crack size. Bigger cracks fail at lower stress. That’s the square root of a in the denominator. This explained why real materials with flaws failed at stresses far below theoretical strength—the flaws acted as crack initiators.
Two: Fracture stress depends on surface energy. That’s the gamma under the square root. Higher surface energy means higher fracture resistance. The material is harder to crack because creating surfaces is more expensive energetically.
Three: Stiffer materials resist fracture better. That’s the E under the square root. Stiffer materials store more strain energy for a given stress, so they have more energy available to drive crack growth, but it turns out that relationship is favorable overall.
But for us, for understanding EMFC, insight number two is the critical one. Surface energy directly controls fracture resistance.
And here’s the key: if you reduce surface energy, you reduce fracture resistance.
That’s the whole game. That’s why EMFC happens. Fluids reduce surface energy, making it easier—energetically cheaper—to create cracks.
From Cracks to Crazes
Now, Griffith was working with glass—brittle, elastic materials. But the framework extends beautifully to polymers and crazing.
A craze isn’t quite a crack. It’s not empty space. It’s a network of polymer fibrils bridging across voids. About 50% void, 50% stretched polymer. But those voids represent surfaces—polymer-air interfaces. Creating a craze requires creating all that void surface area.
The total energy to create a craze includes not just surface energy but also the work to stretch and orient polymer chains into fibrils, and the energy to partially disentangle chains at the craze tip. It’s more complex than a clean brittle crack.
But surface energy remains a critical component. And reducing surface energy still lowers the energy barrier to craze formation and growth. The fundamental principle holds.
Part Two: How Fluids Reduce Surface Energy
Okay, so surface energy matters. But how do fluids reduce it? What’s the physical mechanism?
The Nature of Surfaces
First, let’s understand what surface energy is, physically. Why do surfaces have excess energy at all?
Think about a molecule in the bulk of a material. It’s surrounded by neighbors in all directions—left, right, up, down, forward, back. All those neighbors are interacting with it through various forces: van der Waals forces, dipole interactions, maybe hydrogen bonds. The molecule is in a satisfied state, energetically. All its interaction sites are engaged.
Now think about a molecule at a surface. It’s still got neighbors on the bulk side, but on the surface side? Nothing. Air. Vacuum. Whatever, but not more material. That molecule has unsatisfied interaction sites. It’s in a higher energy state than the bulk molecules.
That excess energy, summed over all the surface molecules and divided by surface area, is the surface energy. It’s literally the energy cost of having a surface instead of bulk.
For a polymer-air interface, that surface energy reflects the unsatisfied molecular interactions at the polymer surface. Typical values: thirty to fifty millijoules per square meter for most common polymers.
What Happens When Fluid Replaces Air
When a fluid contacts that polymer surface—gets into a crack, wets a craze—it replaces the polymer-air interface with a polymer-fluid interface.
The energy of that new interface depends on how well the fluid molecules interact with the polymer molecules. If they interact strongly—if there’s good adhesion between polymer and fluid—the interface has low energy. The polymer surface molecules are satisfied, or at least more satisfied than they were facing air.
The thermodynamic relationship is the Dupré equation:
Dupré work of adhesion
Where WA is the work of adhesion—the energy required to separate the polymer-fluid interface; γPA is the polymer-air surface energy; γFA is the fluidair surface tension, the fluid’s own surface energy; and γPF is the polymer-fluid interfacial energy.
Rearranging this, the reduction in surface energy when fluid replaces air is:
Reduction in surface energy when fluid replaces air
This simple equation tells us everything about which fluids will be aggressive EMFC agents and which won’t.
The Two Factors That Matter
Factor One: Work of Adhesion, WA. How strongly does the fluid stick to the polymer? Strong adhesion means high WA, which means large surface energy reduction.
What creates strong adhesion? Molecular similarity. “Like dissolves like,” the old chemistry saying, applies here. Fluids with molecular structures similar to the polymer create strong interactions.
Polyethylene is a nonpolar hydrocarbon chain. So are many oils, greases, and detergents (which contain long hydrocarbon chains). These fluids adhere well to polyethylene, creating high WA, causing large surface energy reduction.
Polycarbonate is an aromatic ester polymer. Organic solvents with aromatic rings or ester groups—things like toluene, acetone, esters—interact strongly with PC, creating high WA.
Water? Water is highly polar. It doesn’t interact well with nonpolar polymers like PE or PP. Low WA, minimal surface energy reduction, little EMFC effect. But water does interact with polar polymers like nylon (through hydrogen bonding), so water can cause EMFC in nylon even though it’s harmless to PE.
The specificity of EMFC comes from this molecular interaction specificity. Particular fluids attack particular polymers based on molecular compatibility.
Factor Two: Fluid Surface Tension, γFA. The fluid’s own surface tension matters too. Lower surface tension fluids are generally more effective.
Water has high surface tension—about seventy-two millijoules per square meter. Organic solvents have much lower surface tensions, twenty to forty millijoules per square meter. This is part of why organic solvents are more aggressive EMFC agents than water for most polymers.
But here’s where it gets really interesting: surfactants. Surface-active agents, like the detergents in that polyethylene tank story. Surfactants are molecules with one end that likes water and one end that likes oil. They concentrate at interfaces and dramatically lower surface tension.
A detergent solution might have surface tension below thirty millijoules per square meter—less than half of pure water. And detergents often have long hydrocarbon chains that interact favorably with polymers. So they achieve both high WA (good adhesion) and low γFA (low fluid surface tension). Double whammy. Extremely effective EMFC agents.
This is why detergents, soaps, cleaning solutions—mild, innocuous-seeming fluids—are so dangerous to stressed polymers. They’re optimized, almost by accident, to reduce surface energy dramatically.
Some Quantitative Examples
Let me give you numbers to make this concrete.
• Polyethylene to air: γPA is about thirty-five millijoules per square meter.
• Polyethylene to water: γPF is about thirty millijoules per square meter—a small reduction; water doesn’t wet PE well.
• Polyethylene to detergent solution: γPF is about fifteen to twenty millijoules per square meter—a huge reduction; detergent lowers surface tension and wets PE.
• Polyethylene to oil: γPF is about five to ten millijoules per square meter—a massive reduction; oil is very similar to PE molecularly.
So a detergent solution reduces surface energy by forty to fifty percent. An oil might reduce it by seventy to eighty percent. These are enormous changes in the energy balance.
• Polycarbonate to air: γPA is about forty-two millijoules per square meter.
• Polycarbonate to water: γPF is about thirty-eight millijoules per square meter—a small reduction; water barely affects PC.
• Polycarbonate to isopropanol: γPF is about twenty-five millijoules per square meter—a moderate reduction; alcohol partially wets PC.
• Polycarbonate to acetone: γPF is about ten millijoules per square meter—a large reduction; acetone strongly interacts with PC.
Acetone reduces PC surface energy by seventy-five percent. That’s why a drop of acetone on stressed PC can cause instant cracking. The energy barrier to crack growth just collapsed.
Part Three: What Surface Energy Reduction Does
Now we understand that fluids reduce surface energy. Let’s understand what that reduction does to crack growth.
The Initiation threshold drops.
Remember the Griffith equation, σc = √(2Eγ / πa): critical stress is proportional to the square root of surface energy. Reduce surface energy, and you reduce the stress required for crack growth.
Let’s work through an example. Suppose you’ve got a polymer part under stress—let’s say σ equals twenty megapascals. And suppose in air, the critical stress for crack growth from existing flaws is twenty-five megapascals. You’re safe. Twenty is less than twenty-five. No crack growth.
Now introduce a fluid that reduces surface energy by 50%. The new critical stress is:
Critical stress after a 50% surface-energy reduction
Now your applied stress, twenty megapascals, exceeds the critical stress, seventeen point seven megapascals. The crack that was stable in air becomes unstable in the fluid environment. Crack growth begins.
The fluid didn’t add stress. It didn’t mechanically weaken the material. It simply changed the thermodynamic stability criterion. What was safe became unsafe.
This is why EMFC is so insidious. The part was fine. The stress didn’t change. But the environment changed, and suddenly fracture becomes thermodynamically favorable.
No Surface Is Perfect.
Before we talk about how an existing crack grows, let’s back up and ask a basic question: where does that existing crack come from? Because here’s the thing—no surface is perfect. Not one. Every real surface, on every real part, is covered in microscopic flaws.
Think back to Griffith. Remember how glass failed at stresses a hundred times below its theoretical strength? That gap exists precisely because real materials are riddled with tiny pre-existing cracks. The theoretical strength assumes a perfect, flawless solid. Reality never hands you one.
So where do these flaws come from? Everywhere. Processing is a big source—molding, extrusion, and machining leave behind microscopic voids, weld lines, frozen-in stresses, gate marks, and fine surface scratches. Handling adds more: every time a part is touched, wiped, or set down, it picks up abrasion marks. And then there’s the material itself—at the molecular scale, polymers have density fluctuations, chain ends, additive and filler particles, and, in semicrystalline plastics, boundaries between spherulites. Every one of those is a potential crack starter.
How big are these flaws? They span an enormous range. The smallest reside down at the nanometer scale—a few millionths of a millimeter. The ones that matter most for cracking are usually bigger, somewhere from a fraction of a micrometer up to tens, even hundreds, of micrometers. In fact, engineers often model a polymer as if it contains a built-in “inherent flaw” on the order of tens of micrometers—small enough to be invisible to the eye, large enough to be dangerous.
Here’s the key point: you don’t have to create a crack to have a crack. You already have thousands of them, everywhere, on every surface, before the part ever goes into service.
Now here’s something people tend to forget: air is a fluid. In physics, a fluid is anything that flows—and that includes gases, not just liquids. So a part sitting quietly “in air” is actually sitting in a fluid environment. And air is never just air. It carries water vapor—humidity—along with oxygen and whatever else happens to be floating around.
And over time, that air, and the water it carries, works its way into those microscopic fissures. The gaps are so small that capillary forces draw the vapor in and pull it right down to the crack tip. In the very smallest cracks, water vapor can even condense into liquid water when the surrounding air is nowhere near saturated—a quirk of physics that shows up specifically in nanoscale gaps. The crack, in effect, wicks moisture straight out of the air. And here’s a detail worth pausing on, because it ties the whole story together: that capillary pull—that wicking—isn’t some separate force. It’s surface energy again. A liquid is drawn into a tiny gap because moving in lowers the total energy of the system: it trades a high-energy solidandair interface for a lower-energy solidand-liquid one, and the liquid spreads to wet the walls. Whether a fluid wicks in at all comes down to whether it wets the surface—and that is set by the very same balance of surface energies we’ve been discussing. The narrower the gap, the stronger the pull, which is why the smallest cracks, down at the nanometer scale, draw fluid in most fiercely of all.
So surface energy is doing double duty here. It decides whether the fluid can even reach the crack tip—the delivery—and then it decides whether the crack will grow once the fluid arrives—the damage. Same physics at both ends of the process. All roads, again, lead back to energy.
So that “existing crack” we’re about to discuss? It was never truly empty. It was never sitting in a perfect vacuum. Its surfaces are already wetted—by air, by adsorbed water, by whatever the part has been breathing in. The energy balance at that crack tip is already a polymer-to-humidair balance, not a polymer-to-nothing balance. It’s just a slow, mild version of the very same process we’ve been describing. Introduce a more aggressive fluid, and you don’t start the process—you pour fuel on a fire that’s already quietly smoldering.
Crack Growth Accelerates
For an existing crack that’s already growing, surface energy reduction affects growth rate. Crack growth rate typically follows some power law relationship between driving force and resistance:
Crack-growth-rate (power) law
Where G is the energy release rate (the driving force), Gc is the critical energy release rate—the resistance, related to surface energy by Gc = 2γ—and n is some exponent typically between two and four.
When you reduce Gc (by reducing γ), the difference, G − Gc, increases. And because of that power-law relationship, crack growth rate can increase by factors of ten, a hundred, even more for modest reductions in surface energy.
A crack that was growing slowly, maybe a few micrometers per day in air, might grow at millimeters per hour in an aggressive fluid. That’s the difference between a crack that takes years to become critical and a crack that causes failure in hours.
The Physical Doorway: Stress and Free Volume
Before we look at how this all accelerates, we need to talk about what the stress is actually doing at the molecular scale.
We’ve talked about stress as the driving force—the stored elastic energy waiting to be released. But stress isn’t just a force pulling the crack open. It does something structural to the polymer itself. It opens the physical doorway for the fluid.
To understand this, we have to talk about “free volume.”
Think of a polymer not as a solid, impenetrable block of plastic, but as a dense, microscopic bowl of cooked spaghetti. Even when those polymer chains are tightly packed together, there is empty space between them. That empty space is the free volume. It’s the wiggle room that allows chains to move and slide.
When you apply a tensile stress to a polymer, you are literally pulling those chains apart. You are expanding the material. And in doing so, you are increasing that free volume. The intermolecular gaps widen.
This happens everywhere the part is under tension, but it is dramatically magnified at stress concentrations and right at the tip of an existing flaw. The local free volume in those highly stressed regions spikes.
Why does this matter for EMFC? Because fluid molecules need physical space to move.
In an unstressed polymer, the free volume is relatively low. The gaps are tight. Fluid diffusion is slow, sometimes nearly nonexistent. But when you add stress, the polymer dilates. The physical pathways between the polymer chains literally widen.
You aren’t just applying a mechanical load; you are unbarring the door. The stress physically invites the fluid in.
And remember how fluids act in narrow spaces? Those tiny, newly expanded nanometer-scale gaps create enormous capillary pull. The fluid rushes into this expanded free volume, driving straight between the polymer chains.
And this is where we run into a real-world situational comedy.
If you remember the old TV show Three’s Company, you know that the entire premise relies on an interloper and a highly specific situation where misunderstandings lead to total chaos. EMFC is exactly that—a situational comedy, but in the classical, structural sense. For the chaos to unfold, the setup has to be perfect.
Here is the situation: Let’s imagine two of those long polymer chains within our stressed matrix. They are entangled and deeply attracted to one another through weak intermolecular forces. Energetically, they are stable. They are carrying the load together.
Then, the stress pulls them slightly apart, creating just enough free volume for our interloper to enter—the fluid molecule.
Now, because of that “like dissolves like” rule we discussed earlier, this interloper is molecularly similar. It is highly attractive to the polymer chains. So, it slides right into that newly opened space.
Here is the fatal misunderstanding: The polymer chains are energetically drawn to the interloper. They satisfy their local surface energies by bonding with the fluid instead of each other. But the interloper is too short. It can’t entangle. It cannot carry the mechanical load.
The fluid satisfies the surface energy, but it destroys the structural cohesion. The interloper drops the energy barrier so low that the chains simply slip past one another.
The punchline of this situational comedy isn’t laughter. It is a sudden, catastrophic shift in the thermodynamic balance. The stress opened the door, the interloper changed the energy accounting, and the material fails.
This is why the combination is so potent—and why processing and design matter so much in practice. Injection molding often creates a compressive outer skin with reduced free volume, nature’s protective layer. But around gates, at sharp transitions, in overmolded areas, or where assembly puts surfaces into tension, that protection disappears. Free volume spikes locally under load. Those are the exact locations where the door opens widest for aggressive fluids. Field failures almost always start there.
Which leads us directly to how this process feeds on itself.
The Positive Feedback Loop
And here’s where it gets really dangerous: crack growth and fluid penetration create a positive feedback loop.
• Step 1: You’ve got a stressed part with some small crazes or surface flaws. In air, they’re stable or growing very slowly.
• Step 2: The part contacts an EMFC-active fluid. The fluid wets the external surface.
• Step 3: Capillary forces pull fluid into the craze void networks. Those voids are small—nanometers to micrometers—so capillary pressures are enormous. Fluid penetrates rapidly, driven by those capillary forces.
• Step 4: Fluid reaches the craze tips—the active growth zones. Surface energy drops at those critical locations.
• Step 5: With reduced surface energy, crazes grow faster. They widen (more void formation) and lengthen (advancing into bulk material). This creates more void space, more pathways.
• Step 6: The enlarged voids provide even better fluid access. More fluid penetrates deeper. More craze tips get wetted.
• Step 7: Back to Step 5, but now with even more surface area wetted, even more crack tips advancing.
This is self-accelerating. It’s a runaway process. Once it starts, it feeds itself, getting faster and faster until something breaks.
This positive feedback explains the catastrophic nature of EMFC failures. They’re not gradual. They’re not linear. They accelerate. The material doesn’t slowly degrade—it suddenly, rapidly fails once the feedback loop gets going.
Your Insight: Depth and Length
And here’s where your insight about depth and length comes in, and it’s spot-on.
Consider a craze that’s reached some stable configuration in air. It has a certain depth into the material, a certain length along the stress direction. This configuration represents an energy balance: strain energy released equals surface energy created.
Now introduce fluid that reduces surface energy by, say, 50%. The existing configuration is no longer at equilibrium. You’ve reduced the energy cost per unit surface area, but the strain energy released hasn’t changed. The equation is out of balance.
To restore balance, you need more surface area. How do you get more surface area? The craze deepens—it advances further into the material, creating more void volume, more fibril surface area, more interfaces. The craze lengthens—it extends longer in the stress direction, creating more craze length, more total area. And typically you get both deepening and lengthening, because both create the additional surface needed to balance the energy equation.
Quantitatively, if surface energy drops by half, the equilibrium surface area must double (at constant stress). So a craze that was depth d and length l might grow to depth √2·d and length √2·l, because area scales as d × l, and √2 × √2 = 2.
This is why fluids don’t just initiate cracks—they actively drive crack growth to greater depths and lengths. The thermodynamic balance demands it.
Part Four: The Surprising Complexity of Real-World Exposure
Now here’s where theory meets practice, and practice reveals complexities that theory alone wouldn’t predict. I’m going to share some field observations—forensic work, troubleshooting, real failure investigations—that show how energy-mediated fluid cracking behaves in service conditions. And some of these behaviors are counterintuitive until you understand what’s really going on.
The Wet Storage Paradox
Here’s an observation from troubleshooting PC and PC/ABS electronic housings with assembly-induced stress.
Wipe and dry: Take the device, wipe it with solvent-saturated cloth, let it dry. Repeat daily. Result: cracks develop within weeks.
Wet storage: Take an identical device, wrap it in a wet wipe soaked with the same solvent, seal it in a bag, store at forty degrees Celsius for forty-eight hours. Result: some surface damage, stress whitening, but no through-cracks. Device still functional.
Wait—what? The wet storage exposes the part to fluid continuously for 48 hours at elevated temperature. The daily wiping exposes it to fluid for seconds per day at ambient temperature. The wet storage should be more aggressive, right? Wrong. And here’s why.
What happens during wet storage: in the first few minutes to hours, fluid penetrates surface-connected flaws and crazes. Surface energy drops. Initial crack growth begins. But simultaneously, several protective mechanisms activate.
Plasticization: The fluid plasticizes the surface layers. Polymer chains gain mobility. This allows stress relaxation—the material creeps slightly, redistributing stress from peak values to surrounding regions. Peak stress decreases over time.
Swelling: If the fluid causes even modest swelling (volume expansion of the polymer), the swollen surface layers are constrained by the unswollen interior. This creates compressive stresses at the surface—compressive stress directly counteracts the tensile stress driving crack growth.
Equilibration: After hours to days at forty degrees Celsius, the system reaches equilibrium. Cracks have grown to some depth where energy balance is satisfied. Fluid has penetrated, stress has relaxed, and further crack growth stops because the driving force (reduced by relaxation) no longer exceeds the resistance (reduced by surface energy, but now at equilibrium).
The damage stabilizes. Yes, there are crazes. Yes, there’s stress whitening. But the crack depth is only tens or hundreds of micrometers—not enough to cause failure in a part with millimeter-scale walls.
What happens with cyclic wiping is different. Day 1: Fluid applied. Penetrates surface flaws. Surface energy drops. Crack growth begins. But before equilibration, the fluid evaporates. Surface dries. Surface energy partially recovers. Stress relaxation limited because exposure time was brief.
Day 2: Fresh fluid applied to an already-damaged surface. Fluid penetrates to previous crack depths rapidly (pathways already open) and extends deeper. Surface energy drops at new, deeper locations. Crack grows from the previous front. Dries again.
Days three through thirty: Each cycle advances damage incrementally deeper. Each fresh application re-activates surface energy reduction at progressively deeper crack fronts. The system never reaches equilibrium because you keep refreshing the fluid at new locations. After thirty cycles, cracks have grown one hundred to two hundred micrometers or more. Critical crack depth is reached. Component fails.
The cyclic nature prevents the protective equilibration that occurs in continuous immersion. Each application is a fresh attack. Stress relaxation doesn’t help because stress returns during the dry period. The system can’t settle into a stable state.
Why does elevated temperature (forty degrees Celsius) during wet storage actually help? Because it accelerates the protective mechanisms more than the damage mechanisms. At forty degrees Celsius: stress relaxation is five to ten times faster (exponential temperature dependence); plasticization effects develop faster and penetrate deeper; the system reaches equilibrium quickly—hours instead of days; and swelling effects may be enhanced, creating stronger protective compression.
The race between crack growth and stress relaxation/equilibration is won by the protective mechanisms at elevated temperature with continuous exposure. By the time the system equilibrates, cracks haven’t grown critically. But at ambient temperature with cyclic exposure, protective mechanisms never get a chance to win. Each cycle is too brief for relaxation, and cycles repeat before equilibration occurs.
The Acetone Immersion versus Swab Story
Here’s another observation from field testing. Two identical PC/ABS devices with assembly stress.
Device 1—Immersion: Complete device dunked in acetone for 30 seconds, removed, dried, inspected. Result: Surface crazing visible, stress whitening in high-stress regions, but no through-cracks. Device functional.
Device 2—Swab test: Cotton swab saturated with acetone, applied to a corner region where FEA showed a stress concentration of twenty-five megapascals. Brief application, maybe five seconds. Result: Audible crack—snap!—visible fracture propagating from the corner within seconds.
Same fluid, same part, but vastly different outcomes. What gives?
Immersion (global exposure): When you immerse the whole device, you expose the entire surface uniformly. Acetone plasticizes everywhere simultaneously. Before significant crack growth can occur at any specific location, stress relaxation begins throughout the stressed volume. Any crack initiation is distributed among many potential sites—every stress concentration, every flaw. Surface energy reduction is uniform, but so is stress relief. No single location experiences optimal conditions for crack growth before protective mechanisms engage. The result: distributed superficial damage, but no single crack achieves critical size.
Swab test (localized application): The swab delivers fluid specifically to one location—the highest stress region, identified by analysis. This creates optimal worst-case conditions: maximum stress (twenty-five megapascals at the stress concentration); fresh, concentrated fluid (saturated swab); no time for stress relaxation (application duration seconds); all the aggressive factors without any protective factors.
It’s like the difference between heating an entire glass beaker slowly (uniform thermal stress, no fracture) versus touching one spot with an ice cube (localized thermal shock, instant fracture).
The localized application is dramatically more aggressive because it combines maximum stress with maximum chemical attack without allowing protective mechanisms to activate. The lesson: how you apply fluid matters as much as what the fluid is. Distributed exposure can be less damaging than localized exposure because protective mechanisms have time to engage globally before damage localizes.
Part Five: The Dance Between Damage and Protection
What these field observations reveal is something subtle: EMFC isn’t just about crack growth. It’s about a competition between damage mechanisms (crack growth, fibril breakdown) and protective mechanisms (stress relaxation, equilibration, possibly swelling-induced compression).
The Time Scales Matter
Different processes happen at different rates.
• Very fast (seconds to minutes): fluid wetting of external surfaces; initial capillary penetration into surface-connected voids; surface energy reduction at fluid-wetted interfaces.
• Fast (minutes to hours): deeper capillary penetration into crack networks; initial plasticization of surface layers; beginning of stress relaxation in plasticized regions.
• Moderate (hours to days): full plasticization penetration to relevant depths; substantial stress relaxation throughout the stressed volume; the system approaches equilibrium; swelling effects fully develop (if swelling occurs).
• Slow (days to weeks): complete equilibration at given temperature; potential fluid degradation or compositional changes; long-term creep and stress redistribution.
The outcome depends on which processes dominate in the available time. Short exposure (seconds to minutes): damage mechanisms dominate. Surface energy reduction is fast. Crack growth begins immediately. Protective mechanisms haven’t engaged. Most aggressive scenario. Intermediate exposure (hours): competition between damage and protection. Depends on temperature, fluid effectiveness, stress level, material properties. Could go either way. Long exposure (days): if exposure is continuous, protective mechanisms can win and the system equilibrates; if exposure is cyclic (fresh fluid repeatedly applied), damage dominates because equilibration never occurs.
The Role of Stress Relaxation
Stress relaxation deserves special attention because it’s the primary protective mechanism.
Polymers are viscoelastic. Under sustained load, they creep—deform gradually over time. This creep redistributes stress from peak locations (stress concentrations) to broader regions.
The relaxation time depends on temperature and molecular mobility. At room temperature, relaxation in an unplasticized glassy polymer might take weeks. At forty degrees Celsius, maybe days. In a plasticized polymer (one that’s absorbed fluid), relaxation accelerates dramatically—maybe hours or even minutes.
This is why wet storage at forty degrees Celsius can be protective. The combination of temperature and plasticization creates fast relaxation. Stress drops from, say, twenty-five megapascals to fifteen megapascals within hours. At fifteen megapascals, even with reduced surface energy, crack growth rate is much slower. Equilibrium is reached before critical crack depth.
But cyclic exposure at ambient temperature doesn’t allow this. Each exposure is too brief for meaningful relaxation. And during drying, elastic recovery restores stress. The next cycle starts again at high stress.
Materials with faster intrinsic stress relaxation behavior resist cyclic EMFC better, even if their crack growth rates in fluid are similar to other materials. The ability to “relax away” the driving force provides margin that materials without good relaxation don’t have.
The Swelling Effect
We’ve mentioned swelling, but let’s think about it more carefully.
If a fluid causes polymer to swell—increase in volume from fluid absorption—the swollen region wants to expand. But if swelling is localized to surface layers (fluid hasn’t penetrated deeply), the unswollen interior constrains the swollen surface. This constraint creates compressive stress at the surface.
Compressive stress opposes tensile stress. If you’ve got twenty megapascals of tensile stress from applied loads, and swelling creates ten megapascals of compressive stress, the net tensile stress drops to ten megapascals. Lower stress means lower crack driving force.
This is a protective effect. Materials that swell moderately in EMFC-active fluids might actually gain some protection from swelling-induced compression, even though swelling also indicates fluid absorption and plasticization.
The magnitude of this effect depends on how much swelling occurs (higher swelling → more compression), how localized the swelling is (surface swelling only → strong constraint; bulk swelling → no constraint), and the modulus of swollen versus unswollen material. This is subtle stuff, difficult to predict without experiments, but it’s part of the complex competition between damage and protection.
Part Six: What This Means for Testing and Design
These observations—the paradoxes, the complexities, the competitions—have profound implications for how we test materials and design components.
Standard Tests May Mislead
The typical EMFC test protocol: immerse stressed specimen in fluid, measure time to failure. This test captures fluid aggressiveness under one specific condition—continuous immersion.
But if service conditions involve cyclic exposure—cleaning, wiping, intermittent splashing—continuous immersion tests may significantly overestimate service life. Cyclic field exposure can be far more aggressive than lab immersion.
Recommendation: Supplement immersion tests with cyclic exposure protocols. Apply fluid, allow drying, repeat. See if failures occur that immersion tests don’t reveal. Also consider localized application tests—swab tests, drop tests—especially for components where fluid contact is localized in service. These “worst case” tests may reveal vulnerabilities that global immersion misses.
The Value of Forensic Testing
Using FEA to identify high-stress locations, then deliberately attacking those locations with swabs or localized application, is powerful forensic work. You’re creating optimal conditions for failure: maximum stress (from FEA); maximum chemical attack (fresh, concentrated fluid); minimum protection (brief exposure, no relaxation time).
If the part survives this worst-case testing, it’s probably safe in milder service conditions. If it fails, you’ve identified the critical location and can redesign (reduce stress) or change materials. This is like destructive testing in metallurgy—you’re deliberately failing parts to understand failure mechanisms and margins.
Design Strategies That Work
Understanding the mechanisms suggests design strategies.
• Reduce peak stress: always. Lower stress reduces crack driving force and provides margin even when surface energy is reduced. Use FEA to find and mitigate stress concentrations. Generous radii, smooth transitions, avoid sharp corners.
• Design for drainage: if components contact fluids, design so fluids drain quickly and completely. Don’t let fluids pool or get trapped in crevices near high-stress regions. Rapid drainage limits exposure time, reduces damage per cycle.
• Seal critical regions: if possible, isolate high-stress regions from fluid contact. Gaskets, O-rings, barriers, conformal coatings—physical separation can be highly effective.
• Choose materials wisely: not just chemical resistance (immersion resistance) but also stress relaxation behavior. Materials that relax quickly may better resist cyclic EMFC. Impact-modified polymers often have better relaxation than rigid grades.
• Minimize residual stress: processing-induced stress adds to service stress. High residual stress leaves less margin. Optimize processing—slow cooling, lower packing pressure, proper gate design.
• Rethink assembly: snap-fits and press-fits create sustained stress. Can you redesign to eliminate sustained stress? Threaded fasteners, adhesives, alternative geometries?
Now let me pause here, because if we’re talking about residual stress, there’s a question some of you are already forming. I get asked it every so often, and it goes like this: so residual stress is the problem? Well then—why not just anneal it out? I read somewhere that you heat the part up, the stress relaxes, and you’re done. Problem solved. And honestly, that’s a fair question. A really fair question. But my answer comes with a why, and the why is this: a plastic component’s response to its environment depends on its lived experience.
See, during molding, the part is born into a story it never forgets. Hot melt hits a cold mold. The surface freezes first, almost instantly, while the core is still molten. Then the core cools, and as it cools it wants to shrink—but the skin has already hardened and won’t let it. That tug-of-war freezes a compressive stress into the surface layer. And that compressive skin is, in a very real sense, the part’s memory of how it was made. Now here’s the beautiful part: that compressive skin is often protective. Remember, EMFC attacks the surface, and crazes need tension at the surface to open up. A compressive skin squeezes those surface flaws shut. It’s the part holding its own cracks closed, using the very stress it was born with.
Now you can see the trap with annealing. When you heat that part up to relax the stress, you don’t get to choose which stress relaxes. The molecules don’t know which stresses you happened to like. The harmful frozen-in tension relaxes, yes—but so does that protective compressive skin. Annealing is a blunt instrument. It erases the part’s lived experience, the good along with the bad. And here’s the twist that makes it trickier still: that protective skin isn’t even guaranteed in the first place. Depending on how hard the part was packed and how it cooled, the surface might have ended up in tension instead—which is the harmful case. So you can’t actually know whether annealing will help you or hurt you until you know that particular part’s history—until you know its lived experience.
And there’s one more wrinkle, because I want to be straight with you. You’ll find studies that say annealing improves stress-cracking resistance—and they’re not wrong. But here’s the catch: when you hold a polymer like polycarbonate just below its glass transition temperature, you’re not only relaxing stress. You’re also aging it. The molecules settle and pack a little tighter, they form new entanglements, the material quietly densifies. So those studies are often measuring two things at once—a little stress relief and a little physical aging—and the aging all by itself can change how the material resists cracking. Which means you can’t even cleanly say annealing helped because it relieved the stress. Two things changed at the same time. And that, right there, is the whole lesson: a polymer’s response is its entire history, not any single knob you think you turned.
That’s why my answer is never a flat “don’t anneal.” It’s: understand what you’re holding first. If frozen-in tension is driving the cracking, annealing can genuinely help. If a compressive skin is protecting you, annealing can hand that protection away. So fix it at the source where you can—in the processing—and reach for the oven only when you know the story the part is carrying. Because the part remembers how it was born. And if you’re going to rewrite that memory, you’d better know what you’re erasing.
Service and Maintenance Matters
Sometimes the solution isn’t in design or materials—it’s in how the part is used and maintained.
Cleaning protocols: if failures correlate with cleaning, review protocols critically. Can you use a different cleaner (one that doesn’t reduce surface energy)? Reduce cleaning frequency? Rinse with a benign fluid after cleaning to displace the aggressive agent? Avoid wiping high-stress regions?
Education: and yes, I chose that word on purpose, because I’m not a fan of the word training when it comes to people. Over the years I kept running into the same puzzle—so-called trained personnel who simply didn’t follow the process they’d been told, even mandated, to follow. They knew the rule. They ignored it anyway. And I think I finally understand why. At our core, every one of us wants to understand the why. If I believe there’s an easier way to get the job done, I’m going to need a reason to do it differently. So I don’t try to train service personnel—I educate them. I explain the why. When a technician understands why wiping this spot with that solvent can split the part wide open—when they’ve heard the energy story we’ve been telling—they’re far more likely to respect the process. So don’t just say “don’t wipe this area with that solvent.” Tell them why. Educate, don’t train.
Inspection: for critical components, implement inspection for stress whitening or surface crazing. These are early warnings. If you see whitening, investigate before cracks develop.
Part Seven: The Deeper Physics—What Else Is Happening
We’ve focused on surface energy, but there are other effects worth mentioning. EMFC is complex, and surface energy reduction, while the primary mechanism, isn’t the only thing going on.
Effects on Craze Fibrils
Crazes contain polymer fibrils—incredibly fine threads, five to thirty nanometers in diameter, stretched several times their original length, bridging across voids. When fluid replaces air in a craze, it affects the fibrils directly.
Reduced fibril formation energy: creating new fibrils requires generating new fibril surface area. Lower surface energy makes this easier, requiring less stress to form new fibrils during craze widening.
Fibril instability: fibrils are thin cylinders under enormous tensile stress. They’re stable against breakup partly because surface energy resists the increased surface area that would result from fibril breakup. Reduced surface energy reduces this stabilization, making fibrils more prone to necking instabilities and breakup.
Chemical attack: in aggressive fluids—especially those that can cause chain scission—fibrils are particularly vulnerable. They’re highly stressed (stressed bonds break easier), have high surface area (more fluid contact), and contain oriented chains (less entanglement, easier to pull apart). Fluid can attack fibrils directly, causing premature fibril failure.
When enough fibrils fail, the craze transforms into a crack—true empty space. That’s when rapid fracture follows. Surface energy reduction accelerates this craze-to-crack transition through all these pathways.
Molecular Mobility Effects
Fluids that plasticize polymers increase molecular mobility. Higher mobility has multiple effects.
Easier craze formation: mobile chains can rearrange more easily, reducing the stress required to initiate crazes and draw chains into fibrils. Easier shear yielding: more mobility facilitates shear yielding, potentially suppressing crazing in favor of ductile deformation—this is protective, since shear yielding distributes damage and prevents crack localization. Faster stress relaxation: the big protective effect—mobile chains relax stress faster, reducing crack driving force.
The net effect depends on whether damage mechanisms (easier crazing) or protective mechanisms (faster relaxation, possible shear yielding) dominate. This varies with stress level, temperature, exposure time, and material properties.
The Concentration Evolution Effect
When fluid penetrates a crack, its local composition may change over time.
Surfactant adsorption: if the fluid contains surfactants, they may preferentially adsorb to polymer surfaces, depleting the bulk fluid concentration. As concentration drops, surface energy reduction effectiveness may decrease. Selective evaporation: for multi-component fluids (like detergent solutions or solvent mixtures), different components evaporate at different rates. The composition shifts, potentially becoming more or less aggressive. Dilution: water absorption from humidity can dilute organic solvents in cracks, reducing effectiveness. Contamination: polymer degradation products, leached additives, or environmental contaminants can accumulate, changing fluid chemistry.
These effects can reduce EMFC aggressiveness over time in a single continuous exposure—the fluid becomes “spent.” But cyclic exposure with fresh fluid replenishes active components, maintaining high aggressiveness.
Your analogy to crevice corrosion is perfect here. In crevice corrosion, oxygen depletes, pH shifts, and the process becomes self-limiting until fresh electrolyte flushes the crevice. In EMFC, similar self-limiting effects occur, but are defeated by repeated fresh fluid application.
Part Eight: Some Final Thoughts on Thermodynamics and Failure
Let me wrap up with some broader philosophical points about what energy-mediated fluid cracking teaches us.
Thermodynamics Ultimately Governs
Fracture—crack growth, crack formation—is fundamentally a thermodynamic process. It happens when it’s energetically favorable, when the energy released exceeds the energy required.
Griffith understood this a century ago. His energy balance approach transformed fracture mechanics from empirical stress calculations to fundamental thermodynamics.
Energy-mediated fluid cracking is a beautiful illustration of this thermodynamic control. Fluids don’t mechanically weaken polymers. They don’t add stress. They don’t physically push cracks apart. They simply change the accounting—reduce the energy cost per unit crack extension. And that changes everything.
A crack that was thermodynamically stable in air becomes thermodynamically unstable in fluid. Energy balance tips toward crack growth. Failure becomes favorable. And thermodynamics is patient but inexorable—if failure is favorable, it will eventually happen.
Scale Connections Matter
Understanding EMFC requires connecting multiple scales. Molecular: interactions between fluid molecules and polymer chains determine adhesion, work of adhesion, interfacial energy. Nanoscale: craze fibrils are nanometer-scale structures; their formation, stability, and breakdown involve nanoscale processes. Microscale: crazes are microscale features; fluid penetration, void formation, crack tip advance all occur at micrometer scales. Macroscale: component failure is macroscopic—a crack grows to millimeter or centimeter scale, causing structural failure.
You can’t understand the macroscopic failure without understanding what’s happening at every scale below. The molecular interactions determine surface energy. Surface energy governs crack growth at microscale. Microscale crack growth accumulates to macroscopic failure. This is systems thinking. This is holistic engineering. Every scale matters. Every mechanism connects. Understanding one scale in isolation is insufficient—you need to see the whole chain of causation.
Materials Communicate
I always say materials tell their stories. EMFC is a perfect example.
Stress whitening from crazing is the material showing you internal damage. Distributed whitening says “I’m being attacked uniformly.” Localized whitening says “stress is concentrated here.” Progressive whitening over time says “damage is accumulating.” Surface crazing says “stress, check; aggressive fluid, check; EMFC is happening.” Through-cracks say “I reached critical size; energy balance tipped past stability.”
These aren’t just failure modes to document and dismiss. They’re evidence. They’re communication from the material about what happened, what conditions existed, what mechanisms operated. Read the evidence carefully. See what the material is showing you. Let it teach you what went wrong and what to do differently.
The Value of Field Observations
Textbook knowledge is essential—the theory, the frameworks, the fundamental mechanisms. But field observations reveal complexities theory alone might miss.
The wet storage paradox. The swab test versus immersion difference. The cyclic exposure aggressiveness. These came from careful field work, troubleshooting real failures, paying attention to what actually happens rather than what should happen according to simple models.
Don’t discount field observations because they seem to contradict theory. Instead, use them to refine understanding. Ask “why does this happen?” Use theory to explain observations, and use observations to guide theory development. That back-and-forth between theory and practice, between fundamental understanding and real-world complexity—that’s where deep knowledge comes from.
Conclusion: The Story Surface Energy Tells
We’ve covered a lot of ground. From Griffith’s energy balance to surface thermodynamics, from capillary action to stress relaxation, from swab tests to wet storage paradoxes.
Let me distill it to the essentials.
• Energy-mediated fluid cracking happens because fluids reduce surface energy. Reduced surface energy means reduced crack resistance. Cracks that were stable become unstable. Cracks that were growing slowly grow rapidly.
• Which fluids are aggressive depends on molecular interactions. Fluids molecularly similar to the polymer reduce surface energy dramatically. “Like dissolves like” explains specificity. Surfactants are particularly effective because they’re optimized to reduce surface tension and wet surfaces.
• Surface energy reduction demands more crack surface area. When surface energy drops, the existing crack isn’t in energy balance anymore. It must grow—both deeper and longer—to restore equilibrium. Your insight about depth and length is exactly right—it follows directly from thermodynamic balance.
• Cyclic exposure can be more damaging than continuous exposure. Continuous exposure allows protective mechanisms (stress relaxation, equilibration) to engage. Cyclic exposure with fresh fluid prevents equilibration, causing cumulative damage with each cycle. The wet storage paradox illustrates this beautifully.
• Localized application can be more aggressive than immersion. Swab tests deliver concentrated fluid to high-stress locations without time for protective mechanisms. Immersion creates uniform exposure with time for global stress relaxation. Different outcomes from the same fluid.
• Time scales determine outcomes. Fast processes (surface energy reduction, initial crack growth) compete with slower processes (stress relaxation, equilibration). Exposure duration, temperature, and cycling determine which processes dominate and thus whether damage is catastrophic or manageable.
• Testing must match service conditions. Standard immersion tests may not predict cyclic exposure behavior. Localized application tests may reveal vulnerabilities immersion misses. Test as parts will actually be used.
• Design has multiple strategies. Reduce stress. Prevent fluid contact. Choose materials with good stress relaxation. Minimize residual stress. Design for drainage. Seal critical regions. Rethink assembly to eliminate sustained stress.
• Materials tell stories. Stress whitening, crazing patterns, crack locations—all are evidence of conditions and mechanisms. Read the evidence carefully. Let the material teach you what happened.
That’s the surface energy story. That’s how fluids kill polymers. That’s energy-mediated fluid cracking understood through thermodynamics and kinetics, enriched by field observations and practical wisdom.
Understanding EMFC deeply—not just “fluids cause cracks” but why and how and under what conditions—enables intelligent material selection, effective design, meaningful testing, and successful troubleshooting when things go wrong.
Which they will, sometimes. Materials fail. Components crack. Parts break. That’s engineering reality. But with understanding, failures become learning opportunities. Evidence becomes insight. And insight enables prevention.
That’s the journey from failure to wisdom. That’s the path from broken parts to better designs. That’s engineering—understanding deeply, designing thoughtfully, learning continuously.
Thanks for joining me on this deep dive into surface energy, thermodynamics, and the surprising complexity of how fluids affect crack growth. I hope you see energy-mediated fluid cracking differently now—not as mysterious material weakness, but as predictable consequence of energy balances, explainable through physics, preventable through understanding.
Now go look at your components, think about their stress states, consider their fluid exposures, and design with this knowledge. Make things that last. Make things that resist failure even in hostile environments. Make things that work.
That’s the goal. That’s the craft. That’s engineering done right.
And when failures happen—because they will—read what the material is telling you, understand the mechanisms, fix the root cause, and build better next time. That’s the cycle of improvement. That’s how we learn. That’s how engineering progresses.
Listen to the materials. Understand the thermodynamics. Design with wisdom. That’s the holistic way.
Thank you for listening.
This has been Joe McFadden.
Combating engineering mind blindness.
Engineer. Lifelong Learner. Holistic Analyst.
www dot McFadden C A E dot com. McFadden at s net dot net.
Have a thoughtful and wonderful day.
End of audiobook.
Paradigm Shift, technical Essay
Link to audiobook→ https://www.dropbox.com/scl/fi/t2n70r581g72d1pmhm3om/EMFC_Paradigm_Shift_McFadden_28June2026-1.mp3?rlkey=8a3o3x1dg7wo5kvqandzkez2q&st=j16o016b&dl=0
Energy-Mediated Fluid Cracking:
A Paradigm Shift in Understanding Polymer Failure
Joseph P. McFadden Sr. & Claude
November 10, 2025 · Revised June 2026
Abstract
This essay presents a comprehensive examination of what has traditionally been termed “environmental stress cracking” (ESC) in polymers, proposing instead the mechanistically accurate terminology of “Energy-Mediated Fluid Cracking” (EMFC). Through integration of Griffith’s fracture-mechanics framework1 with the thermodynamic principles of surface-energy reduction, this work elucidates how fluids facilitate catastrophic polymer failure not through chemical degradation or stress concentration, but through fundamental alterations in crack-propagation energetics. Field observations spanning four decades reveal counterintuitive phenomena — including enhanced damage from cyclic versus continuous exposure and the paradoxical protective effect of elevated temperatures during fluid contact — that become predictable when viewed through an energy-based lens rather than a traditional stress-focused one.
1. Introduction: Reframing a Persistent Engineering Challenge
The failure of polymer components in the presence of seemingly benign fluids is one of the most economically significant yet mechanistically misunderstood phenomena in materials engineering. A polyethylene storage tank that has reliably contained water for years can fail catastrophically within 48 hours of exposure to a mild detergent solution. A polycarbonate medical-device component, having undergone extensive validation testing, may crack audibly upon routine cleaning with isopropanol — a fluid that neither dissolves nor chemically attacks the polymer matrix.
These failures, traditionally attributed to “environmental stress cracking,” are frequently estimated to account for 15–30% of all polymer component failures in service.2 Yet the conventional terminology obscures the fundamental physics: these are not primarily stress-driven or environmentally mediated failures, but thermodynamically driven crack-propagation events facilitated by fluid-induced reduction in surface energy at crack interfaces.
2. The Thermodynamic Foundation: Griffith’s Energy Balance Revisited
2.1 Classical Fracture-Mechanics Framework
Griffith’s seminal work1 — first set out in 1921 and refined in 19243 — established that crack propagation occurs when the energy release rate G equals or exceeds the critical energy release rate Gc, where:
Gc = 2γs
Here γs is the surface energy of the material. This elegantly simple relationship reveals that crack growth is fundamentally an energy-balance problem: the elastic strain energy released during crack extension must overcome the energy required to create new surfaces.
2.2 The Fluid-Intervention Mechanism
When a fluid contacts a crack tip, it fundamentally alters this energy balance. In a liquid environment, advancing the crack creates two new solid–liquid interfaces rather than two solid–vapor surfaces, so the energy that must be supplied per unit of crack area becomes:
Gc,fluid = 2γsl
where γsl is the solid–liquid interfacial energy. Because a well-wetting fluid has a low γsl, the toughness required for propagation falls. The magnitude of that reduction follows from the Dupré relation4, Wa = γs + γl − γsl:
ΔGc = Gc,fluid − Gc = 2γsl − 2γs = −2(γs − γsl) = −2(Wa − γl)
where Wa is the work of adhesion between fluid and polymer and γl is the fluid’s own surface tension. The greater the adhesion Wa relative to the fluid’s cohesion, the more negative ΔGc becomes — that is, the more the fluid lowers the barrier to crack growth. This framework reveals why certain polymer–fluid pairs exhibit catastrophic compatibility problems while others remain benign: the controlling factor is not chemical reactivity but how strongly the fluid adheres to the freshly created crack surfaces relative to its own cohesion.
3. Molecular-Scale Mechanisms: Beyond Bulk Properties
3.1 The Critical Role of Molecular Fit
The effectiveness of a fluid in promoting crack growth depends critically on molecular-scale interactions at the crack tip. Small molecules of appropriate polarity can penetrate the dilated, highly stressed region ahead of the crack tip, where polymer chains are extended and intermolecular spacing is increased. This penetration can be conceptualized as a “molecular wedging” effect.
Fluid molecules small enough to enter this region, yet interacting strongly enough to impede chain re-entanglement, create favorable conditions for accelerated crack growth. The general influence of molecular weight, entanglement, and chain mobility on polymer fracture is treated by Ward and Hadley5; the specific picture of craze breakdown by fibril disentanglement is most closely associated with Kramer’s work on crazing. This interplay of molecular size and interaction strength helps explain why seemingly similar fluids can have dramatically different effects on the same polymer.
3.2 Hansen Solubility Parameters as Predictive Tools
The Hansen Solubility Parameter (HSP) framework6 provides quantitative predictions of polymer–fluid compatibility through a three-dimensional solubility space:
• δd: dispersion forces
• δp: polar interactions
• δh: hydrogen bonding
The critical insight is that a fluid need not be a good solvent (small HSP distance) to cause EMFC. Fluids at intermediate HSP distances — close enough to interact strongly, but not so close as to cause bulk swelling — are often the most dangerous. This “compatibility sweet spot” lies at intermediate Hansen distances rather than at zero (often on the order of 5–15 MPa1/2, though the exact window is polymer-dependent), where molecular interaction is sufficient to reduce surface energy without triggering the protective stress relaxation that accompanies pronounced swelling.
4. Field Observations: Complexities Beyond Laboratory Predictions
4.1 The Cyclic-Exposure Paradox
Extensive field investigations reveal a counterintuitive phenomenon: cyclic fluid exposure often causes more severe damage than continuous immersion. This contradicts simple stress-corrosion models but becomes comprehensible through energy-based analysis.
During continuous immersion, polymers undergo stress relaxation through molecular rearrangement and limited swelling. This relaxation, while not eliminating stress, redistributes it in ways that reduce the driving force for crack propagation. Conversely, cyclic exposure — particularly with drying periods between fluid contact — prevents complete stress relaxation while repeatedly delivering fresh fluid to newly created crack surfaces.
The competition is governed by the polymer’s characteristic relaxation time, which itself varies widely with temperature and physical aging. When the wet–dry cycle is short relative to that relaxation time, stress cannot fully relax between wetting events and damage accumulates cycle by cycle; continuous immersion, by contrast, allows relaxation to proceed toward a more protective steady state. The role of diffusion kinetics in determining where and when crazes initiate under fluid exposure has been examined directly in slow-strain-rate studies of glassy polymers.7
4.2 Temperature Effects: Protection Through Acceleration
Another field observation defies conventional wisdom: maintaining an elevated temperature during fluid exposure can actually prevent cracking, despite the acceleration of chemical kinetics. The apparent paradox resolves when one considers competing, thermally activated rate processes:
Rate of stress relaxation ∝ exp(−Erelax / RT)
Rate of fluid penetration ∝ exp(−Ediff / RT)
The more strongly temperature-dependent process is the one with the larger activation energy. Elevated temperature therefore accelerates stress relaxation faster than fluid penetration only when Erelax > Ediff. Where that condition holds, heating shifts the balance toward protective relaxation — which helps explain why hot-water washing often proves less damaging than room-temperature solvent exposure, despite the greater thermal energy nominally available to drive crack propagation.
4.3 Loading-Rate Dependencies
Field failures also depend strongly on loading rate. The numerical boundaries below are approximate and material-dependent, but three qualitative regimes recur:
• Slow / sustained loading (very roughly < 10-6 s-1): molecular rearrangement and stress relaxation have time to occur, favoring ductile response. Note, however, that sustained static load is itself a classic ESC condition — standard tests such as the bent-strip, full-notch creep, and pressurized-pipe tests deliberately hold parts under constant load — so “slow” is not synonymous with “safe.” Whether slow loading is benign or damaging depends on whether relaxation outpaces fluid-assisted slow crack growth.
• Intermediate / cyclic loading (roughly 10-6 to 10-2 s-1): frequently the regime of greatest EMFC susceptibility, allowing time for fluid penetration but not for full protective relaxation.
• Impact / fast loading (very roughly > 10-2 s-1): brittle fracture tends to dominate, and loading can outpace fluid transport to the crack tip, partially isolating it from fluid effects.
5. Predictive Modeling: From Empiricism to Mechanism
5.1 The Modified Paris Law for EMFC
Crack growth under cyclic loading with fluid exposure can be described by a modified Paris equation8:
da/dN = C(ΔK)n · f(θ)
where f(θ) is a fluid-modification factor dependent on the contact angle θ, related to surface energy through Young’s equation:
cos(θ) = (γsv − γsl) / γlv
This formulation enables quantitative prediction of crack-growth rates from measurable surface properties rather than from purely empirical fitting parameters.
5.2 Time–Temperature–Fluid Superposition
Building on time–temperature superposition principles9, one can construct master curves for EMFC susceptibility:
log(tf) = log(t0) − C1(T − Tref) / [C2 + (T − Tref)] + Δfluid
where Δfluid is a fluid-induced shift factor, estimable from HSP distances and surface-energy considerations. This approach enables prediction of long-term performance from short-term tests across a range of temperature–fluid combinations.
6. Prevention Strategies: Design Through Understanding
6.1 Material-Selection Criteria
Effective EMFC prevention requires moving beyond simple chemical-resistance tables to consider:
• Surface-energy matching: select polymer–fluid pairs with minimal interfacial-energy reduction.
• Molecular architecture: highly entangled or crosslinked structures resist fluid penetration.
• Crystallinity and morphology: crystalline regions act as fluid-impermeable barriers, but crystallinity must be balanced against its effect on tie-molecule density (see §7.1).
6.2 Design Modifications
Engineering solutions grounded in mechanistic understanding include:
• Stress-state management: design for compressive rather than tensile surface stresses wherever fluid contact is unavoidable.
• Barrier coatings: apply dense, impermeable or low-surface-energy (e.g., fluoropolymer) coatings to limit fluid wetting and access to crack-susceptible substrates. Because high-energy surfaces are more readily wetted, the goal is a good diffusion barrier and/or a poorly wetted, low-energy outer surface — not a high-energy one.
• Controlled fluid exposure: where possible, favor continuous immersion over cyclic wet–dry exposure.
This recommendation deserves elaboration, because the most readily available source of surface compression is frequently the molding process itself. During injection molding the surface layer solidifies against the cold mold while the core remains molten; as the core subsequently cools and contracts, the already-rigid skin constrains it, leaving the surface in residual compression and the core in residual tension. Such a compressive skin is protective against EMFC, because craze and surface-crack initiation require a net surface tensile stress. The locally experienced stress is the superposition of applied and residual contributions,
σnet = σapp + σres
with σres < 0 at a compression-skinned surface. A compressive σres must be overcome before the net surface stress reaches the critical craze-initiation value, which raises the effective threshold for initiation. The protective influence of compressive residual stress on the ESC resistance of polycarbonate has been demonstrated directly.11
This same reasoning counsels caution against the reflexive recommendation to anneal components solely to relieve residual stress. Annealing relaxes the entire residual-stress field toward zero; it is not selective, and therefore removes any protective surface compression together with the detrimental tensile stress it was intended to address. The net effect is, moreover, process-dependent: although differential cooling tends to place the surface in compression, holding (packing) pressure imposed during solidification can instead leave the surface in residual tension, inverting the protective state — so that whether annealing helps or harms cannot be known without first characterizing the actual stress distribution, for example by photoelastic (birefringence) inspection or the hole-drilling method.11 A further confound applies specifically to glassy polymers such as polycarbonate: sub-Tg annealing simultaneously induces physical aging — densification and the formation of additional cohesional entanglements — which itself alters craze-initiation behavior, so that reported improvements in ESC resistance following annealing reflect a combination of stress relief and physical aging rather than stress relief alone.12 The sound practice is therefore to address residual stress preferentially at its processing source, reserving annealing for cases in which the stress state is known and a net benefit can be anticipated.
6.3 Accelerated-Testing Protocols
Traditional EMFC tests often fail to replicate field conditions. Mechanistically informed protocols should incorporate:
• realistic cyclic-exposure patterns matching application-specific duty cycles;
• temperature variations reflecting service conditions;
• multiple fluid challenges representing the full range of anticipated exposures;
• strain-rate variations spanning the intermediate “danger zone.”
6.4 Operational and Maintenance Practice
Even a well-designed component remains vulnerable if its service environment is managed without regard to EMFC. Where failures correlate with cleaning or maintenance, the responsible protocols warrant critical review: substituting a cleaning agent that does not appreciably reduce surface energy, reducing the frequency of exposure, rinsing with a benign fluid to displace an aggressive agent, and avoiding the application of solvents to high-stress regions are all low-cost interventions. For critical components, periodic inspection for stress whitening or incipient surface crazing provides early warning before through-cracks develop.
The most durable safeguard, however, is comprehension rather than compliance. A mandated procedure is a weak control: personnel who do not understand the reason behind a restriction tend not to observe it consistently, particularly when an unaware shortcut appears easier. Conveying the underlying mechanism — why contacting a specific high-stress region with a specific solvent can precipitate fracture — produces more reliable adherence than instruction alone. Maintenance documentation and personnel development should therefore explain the energy-mediated basis of the failure mode rather than merely prohibit the triggering action. Education, in this sense, is a more effective preventive measure than training.
7. Case Studies: Theory Applied to Practice
7.1 Polyethylene Infrastructure Failures
Analysis of polyethylene pipe failures in municipal water systems shows that catastrophic failures tend to cluster around:
• installation of water-treatment facilities that introduce cyclic chloramine exposure;
• seasonal temperature variation that creates cyclic stress through thermal expansion;
• pressure-surge events that briefly enter the intermediate strain-rate regime.
Application of EMFC principles led to revised specifications emphasizing:
• bimodal molecular-weight distributions (e.g., PE100-type resins) to raise tie-molecule density and chain entanglement — the dominant lever for ESCR in polyethylene;
• controlled crystallinity and morphology: higher crystallinity reduces fluid permeation, but pursued in isolation it can lower tie-molecule density and worsen ESCR, so density is optimized in concert with molecular weight rather than simply maximized;
• stress-concentration factors below roughly 2.5 at all joints and fittings.
7.2 Medical-Device Sterilization Challenges
Polycarbonate components in reusable medical devices face repeated exposure to various disinfectants. EMFC analysis revealed that quaternary ammonium compounds, despite being “approved” cleaning agents, reduced surface energy by about 40% at typical use concentrations in the cases examined.
Mitigation strategies included:
• transitioning to copolymer grades with reduced fluid affinity;
• applying barrier surface treatments — for example, plasma-deposited or low-surface-energy films — to limit disinfectant wetting and penetration at susceptible surfaces;
• developing cleaning protocols that keep surfaces wetted at 60°C to promote stress relaxation.
8. Future Directions: Advancing the EMFC Paradigm
8.1 Computational Approaches
Molecular-dynamics simulations10 now enable atomic-level visualization of fluid penetration at crack tips. These tools promise prediction of EMFC susceptibility from molecular structure alone, virtual screening of polymer–fluid combinations, and the design of EMFC-resistant polymers through computational chemistry.
8.2 In-Situ Characterization
Advanced characterization techniques — including environmental scanning electron microscopy for real-time crack-tip observation, micro-Raman spectroscopy for stress-field mapping during fluid exposure, and synchrotron X-ray scattering for molecular-level structural changes — will refine our understanding of the precise sequence of events during EMFC initiation and propagation.
8.3 Bio-Inspired Solutions
Natural materials show remarkable resistance to fluid-induced failure through hierarchical structures that arrest crack propagation, self-healing mechanisms activated by fluid exposure, and gradient properties that redistribute stress. Biomimetic approaches may yield next-generation EMFC-resistant materials.
9. Conclusion: The Power of Mechanistic Understanding
The shift from “environmental stress cracking” to “Energy-Mediated Fluid Cracking” represents more than semantic refinement — it embodies a reorientation from phenomenological observation to mechanistic understanding. By centering energy rather than stress, and thermodynamics rather than empirical correlation, we transform EMFC from an unpredictable material weakness into a quantifiable, preventable failure mode.
This energy-based framework reconciles previously paradoxical observations: why mild detergents can be more damaging than strong solvents, why cyclic exposure can exceed continuous immersion in severity, and why elevated temperature can provide protection despite accelerating chemical processes. These are not anomalies but predictable consequences of competing thermodynamic and kinetic processes.
For the practicing engineer, this understanding translates into actionable design principles. Rather than relying solely on conservative safety factors and extensive empirical testing, we can predict EMFC susceptibility from fundamental material properties, design targeted prevention strategies, and develop accelerated tests that more accurately reflect field conditions.
The economic impact of EMFC — measured in billions of dollars annually across industries from infrastructure to medical devices — justifies this level of fundamental understanding. As polymer applications expand into ever more demanding environments, from deep-sea oil extraction to implantable devices, the ability to predict and prevent fluid-induced failure becomes increasingly critical.
The journey from mysterious failures to mechanistic mastery exemplifies the power of fundamental science applied to practical engineering. By understanding why fluids kill polymers, we gain the knowledge to ensure they don’t.
References
1. Griffith, A. A. (1921). “The phenomena of rupture and flow in solids.” Philosophical Transactions of the Royal Society A, 221, 163–198.
2. Wright, D. C. (1996). Environmental Stress Cracking of Plastics. RAPRA Technology Ltd.
3. Griffith, A. A. (1924). “The theory of rupture.” Proceedings of the First International Congress of Applied Mechanics, 55–63.
4. Dupré, A. (1869). Théorie Mécanique de la Chaleur. Gauthier-Villars.
5. Ward, I. M., & Hadley, D. W. (1993). An Introduction to the Mechanical Properties of Solid Polymers. Wiley.
6. Hansen, C. M. (2007). Hansen Solubility Parameters: A User’s Handbook (2nd ed.). CRC Press.
7. Arnold, J. C. (1998). “The effects of diffusion on environmental stress crack initiation in PMMA.” Journal of Materials Science, 33(21), 5193–5204.
8. Paris, P., & Erdogan, F. (1963). “A critical analysis of crack propagation laws.” Journal of Basic Engineering, 85(4), 528–534.
9. Williams, M. L., Landel, R. F., & Ferry, J. D. (1955). “The temperature dependence of relaxation mechanisms in amorphous polymers and other glass-forming liquids.” Journal of the American Chemical Society, 77(14), 3701–3707.
10. Hossain, D., Tschopp, M. A., Ward, D. K., et al. (2010). “Molecular dynamics simulations of deformation mechanisms of amorphous polyethylene.” Polymer, 51(25), 6071–6083.
11. Magnier, A., Scholtes, B., & Niendorf, T. (2018). “On the reliability of residual stress measurements in polycarbonate samples by the hole drilling method.” Polymer Testing, 71, 329–334.
12. Yan, C., Han, J., Zhang, J., Zhao, F., Liu, C., & Shen, C. (2016). “The influence of sub-Tg annealing on environmental stress cracking resistance of polycarbonate.” Polymer Testing, 56, 364–368.
About This Essay
This technical essay serves as a companion piece to the audiobook “How Fluids Kill Polymers: The Energy-Mediated Fluid Cracking Story” by Joseph McFadden. While the audiobook provides a conversational exploration of EMFC phenomena through lived experience and field observation, this essay presents the underlying scientific framework with formal citations and mathematical relationships. Together, they offer complementary perspectives — one experiential and accessible, the other rigorous and quantitative — on a critical challenge in polymer engineering.
The integration of listening and reading creates a multi-modal learning experience that aids comprehension and retention. The audiobook’s narrative flow and practical examples provide context and motivation, while this essay’s structured presentation and technical depth enable deeper understanding of the fundamental mechanisms. Readers are encouraged to engage with both formats.

The Poke
The Poke
How a Local Disturbance Becomes a Conversation — and Why Everything Comes Back to Energy
Joseph P. McFadden · McFaddenCAE.com
An essay on how a single disturbance travels through gases, liquids, and solids — and on why understanding it means understanding energy, the one thing we measure everywhere and name nowhere.
For a deeper dive see my posting on Updated Detailed discussion on Display Glass…..
Contents
01 Why We Poke
02 The Poke Is a Question
03 Gases: Consensus by Collision
04 Liquids: The Crowded Room
05 Solids: Communication Acquires a Grammar
06 Rayleigh's Wave: The Surface Carries Its Own Message
07 Phonons: The Atomic Language of Vibration
08 Glass: A Network With No Address Book
09 Plastics: A Message Filtered Through Molecular Time
10 Metals: Communication With Shock Absorbers
11 Every Surface Changes the Rules
12 Turning the Tables: Engineering the Conversation
13 What the System Heard
14 The Material Is the Conversation
Why We Poke
Watch anyone encounter something unfamiliar and you will see the same ancient gesture. A child meets a new object and pushes it. A mechanic taps a casting and listens. A geologist strikes a rock. A materials engineer drops a device onto concrete, or pulls a coupon in a load frame until it complains. Before we measure anything, before we theorize, we poke — and then we watch, and listen, for the answer.
It is worth asking why this is so deeply in our nature, because the answer turns out to be the same answer that governs the poke itself.
We are, in the most literal thermodynamic sense, dissipative systems. A living thing is a pocket of order that sustains itself by taking in high-quality energy, using it, and shedding low-quality energy — heat — to its surroundings. We do not persist in spite of the second law of thermodynamics; we persist by serving it, accelerating the universe's slide toward disorder more efficiently than the bare matter we are made of could manage alone. A candle flame, a hurricane, and a human being are cousins in this respect: each is a structure that exists because it dissipates a flow of energy, and each would vanish the moment that flow stopped.
Some of the most interesting thinking of the last decade — Jeremy England's work on dissipation-driven adaptation, building on Prigogine's dissipative structures — argues that this is not incidental to life but close to its origin. Matter driven hard enough by an energy source tends to fall into arrangements that dissipate that source better. Order emerges not against the current but because of it. If that view is even partly right, then curiosity itself — the drive to probe, to disturb, to learn how the world will respond — is a phenotype of energy dissipation. We poke because we are the kind of structure that energy flow builds, and probing our environment is how such a structure finds and manages the gradients it feeds on.
We poke because we are the kind of structure that energy flow builds. And here is the quiet strangeness at the center of it: the very thing we are made of, the very thing we chase and shed and are driven by, is the one thing we cannot actually say we understand. We can write energy's bookkeeping to astonishing precision. We cannot say what it is.
I do not want to wander too far into that particular fog, because this essay is about something concrete: what happens when you poke a material. But I raise it deliberately, because I think it reframes the whole exercise. When we poke a piece of glass, we are one energy-processing system interrogating another. The material's response — the wave that races out, the heat that blooms, the crack that runs — is that material managing an energy flow of its own, on its own terms, according to its own structure and history. The poke is not us acting on a passive object. It is two dissipative systems, briefly, in conversation. And the language they speak is energy.
Hold that frame, because everything below is one long argument that all roads — sound, heat, stiffness, fracture, damping, the ring of a glass and the silence of a crack — lead back to it.
The Poke Is a Question
Press a fingertip against any material and you have asked it a question at a single point. Energy and momentum enter one small region. Yet the response almost never stays there. The atoms nearby do not, as a rule, travel with the disturbance; instead they shove their neighbors, who shove theirs, and a disturbance propagates outward even though no single atom crosses the room.
Picture a crowded hall in which one person is pushed. That person stumbles into the next, who leans into the next, and a wave of jostling crosses the room while every individual stays roughly where they began. A mechanical wave in matter behaves much the same way. What travels is not the stuff but the state — a change in pressure, density, displacement, stress, strain, temperature, molecular configuration, or damage — handed from neighbor to neighbor.
How fast and how faithfully that message travels depends on the material's stiffness, its density, its internal architecture, and — crucially — the timescale of the poke. A stiff, light material relays an elastic message quickly; a soft, dense one, slowly. But speed is only the beginning. As the message travels it can spread, disperse, reflect, change form, and bleed its organized energy into disorganized molecular motion — heat. The message that arrives at a distant point is rarely a faithful copy of the poke. The material edits it in transit. Learning to read those edits is most of what materials characterization actually is.
Gases: Consensus by Collision
Begin with the most dilute crowd, where molecules spend nearly all their time in free flight and meet only in fleeting collisions. Poke a gas — clap your hands, drive a piston — and you crowd molecules into a smaller space; their collision rate rises; that local pressure bump shoves the molecules just beyond it, and the compression travels outward as a longitudinal pressure wave, particle motion running parallel to the direction of travel.
Because there is no permanent structure to carry the news, it can travel no faster than the messengers themselves. This is why the speed of sound in air — about 343 meters per second at room temperature — sits just below the average thermal speed of the molecules. Sound in a gas is a statistical consensus propagating through a randomized three-dimensional Newton's cradle, always a step behind the gossip that carries it.
Two consequences follow, and both echo all the way up to glass. First, a gas transmits only compression. Push molecules together and they push back; try to shear a gas — slide one layer across another — and nothing restoring happens, because nothing connects the layers. A gas has one communication channel. Second, the relay leaks. Every collision randomizes a little organized push into disordered heat, so the pulse attenuates, and high frequencies — which demand many faithful relays per unit time — fade first. A gentle poke gives a soft, nearly linear acoustic wave. A violent one gives a different conversation entirely: compressed regions travel faster than rarefied ones, the front steepens, and a shock wave forms — the message sharpened from a whisper into an abrupt announcement.
Surfaces in a gas
Reach a wall and the rules change. The gas can no longer move freely; some energy reflects, some passes into the wall, some dissipates in the thin viscous and thermal layer at the boundary. A rigid wall reflects strongly; a soft or porous surface absorbs; a tube guides; a chamber selects resonant tones; corners and openings scatter. The same poke in an open field, a pipe, a padded room, and a steel box produces four different conversations. Geometry is already part of the medium — a theme that only deepens as the matter stiffens.
Liquids: The Crowded Room
Condense the crowd until molecules touch continuously and you have a liquid. Now a push transmits not by flight and collision but by direct contact through the repulsive walls of neighboring molecules — a shove passed hand to hand through a packed room rather than shouted across a field. The relay is far stiffer and faster: sound in water travels about 1,480 meters per second, roughly four times its speed in air, because the medium resists compression through contact rather than through the statistics of collisions.
But a liquid still holds its neighbors loosely. Shear it slowly and the molecules simply rearrange and forget; the disturbance dissipates as viscosity rather than propagating as a wave. Shear it fast enough — faster than the molecules can rearrange — and a liquid briefly answers like a solid, transmitting shear before it can relax. Experiments have caught exactly this: transverse acoustic excitations in liquid metals, and solid-like high-frequency response in water.
Whether matter behaves as a liquid or a solid can depend on how quickly you ask. Give the molecules time and they flow; deny them time and they answer as if caged. A liquid is a solid that forgets quickly; a glass, as we will see, is a liquid that forgets on a timescale longer than civilizations.
Free surfaces and cavitation
A liquid's surface adds behaviors its bulk never shows. At the boundary, pressure, inertia, gravity, and surface tension negotiate, and a poke can launch ripples that travel along the surface — gravity waves at long wavelength, capillary waves at short. The free surface also reflects pressure waves back inward, and because a liquid tolerates compression far better than tension, a compressive pulse reflecting from a free surface can return inverted, as tension. Pull hard enough that way and the liquid tears: vapor cavities open where none existed. This is cavitation, and it is worth dwelling on, because a bubble is an internal surface that did not exist a moment earlier. Once born, it rewrites the local conversation — scattering incoming waves, oscillating, and, when it collapses near a solid wall, focusing energy into a needle-fine jet that can pit hardened steel. Even in a liquid, the creation of a surface can turn a smooth traveling message into a concentrated local attack. Remember that. It is the whole story of fracture, rehearsed in water.
Solids: Communication Acquires a Grammar
Bond the crowd permanently and everything changes. In a solid, every atom sits in a well built by its neighbors, tied to them by bonds that behave, for small displacements, like springs. A poke no longer pushes messengers around; it stretches the network, and the network answers collectively. Because a solid resists both compression and shear, it possesses two body-wave channels at last: longitudinal (compressional, or P) waves, atoms oscillating along the direction of travel, and transverse (shear, or S) waves, atoms oscillating across it. The speeds follow from stiffness and density — longitudinal from the bulk-plus-shear response, shear from the shear modulus alone — so the longitudinal wave is always the faster, and in stiff solids both are very fast: roughly 5,000 to 6,000 meters per second for the compressional wave in silicate glass or steel. The existence of that shear channel is the dividing line. A gas or an ordinary liquid, lacking a static shear modulus, cannot carry a low-frequency shear body wave at all. A solid can, and with it gains a second language.
A real poke on a solid never launches just one clean wave. It sets off a family — longitudinal, shear, bending, contact, and surface waves — which then reflect from every boundary, return, and interfere into a rich history. The solid does not merely register how hard it was struck. It registers the duration, the rise time, the frequency content, the direction, the contact area, and the location. A sharp tap carries a broad band of frequencies; a slow push, mostly low ones. Two pokes with identical peak force can deliver utterly different messages, and provoke utterly different answers. This is precisely why, in a device, loading rate and temperature must be judged for the whole load path, never for a single part in isolation.
Rayleigh's Wave: The Surface Carries Its Own Message
There is a third messenger, and it belongs to Lord Rayleigh — John William Strutt — who showed in 1885 that a free surface supports a wave of its own. A Rayleigh wave rolls along the surface in an elliptical, retrograde motion, a hybrid of compression and shear, its amplitude decaying exponentially with depth so that most of its energy travels within about one wavelength of the surface. It moves a touch slower than the bulk shear wave, typically around ninety percent of that speed. Earthquakes deliver much of their damage through Rayleigh waves for exactly this reason: the energy refuses to spread into the depth and instead runs concentrated along the surface, where everything we build sits.
Hold that geometry, because in a sheet of cover glass everything we care about also lives at the surface. Scratches, handling marks, corrosion pits, coating interfaces, contact edges, and above all the flaws left by cutting — all occupy the exact skin where Rayleigh energy concentrates. A blow that looks mild when averaged over the whole part can be severe in that near-surface zone. And in a thin plate, the two surfaces conspire further: their Rayleigh-like motions couple through the thickness into guided Lamb waves, whose speeds depend on frequency and plate thickness, so that the component's geometry becomes inseparable from its wave behavior. The material and the shape speak together, always.
Phonons: The Atomic Language of Vibration
At engineering scale we describe all this with smooth fields — stress, strain, density, displacement varying continuously through the body. At the atomic scale the same communication has a different name. In a solid, displacing one atom changes the forces on its neighbors, and the disturbance spreads as a coordinated lattice vibration. Quantized — counted in the smallest allowed packets — those vibrations are phonons.
A phonon is to a lattice vibration what a photon is to light: the smallest unit of the wave, a quantum of collective vibrational energy carrying a frequency and a direction. It is not a tiny bead rattling between atoms; it is an organized excitation the whole lattice shares. Every mechanical message a solid sends itself — sound, heat, the stress field racing ahead of a crack tip — is written in phonons. Long-wavelength acoustic phonons are exactly the elastic waves of continuum mechanics, seen up close. As wavelengths shrink toward the atomic spacing, the discreteness of the lattice starts to matter, new vibrational branches appear, and scattering grows important. And phonons interact — with each other, with electrons, with point defects, dislocations, grain boundaries, phase boundaries, and free surfaces. Every interaction is another chance for the message to be redirected, attenuated, or converted into another form of energy. Every one is a road, and every road runs toward the same destination: energy, redistributed.
Glass: A Network With No Address Book
Glass is the most revealing solid of all, because it is rigid without being periodic — a silicate network frozen into permanent disorder, a solid by every mechanical test and a liquid by ancestry. Its bonds are as stiff as any crystal's, so the speed of communication stays high, and at long wavelengths it carries ordinary P and S waves cleanly. But the network has no repeating structure, and this transforms the fidelity of communication.
In a perfect crystal a phonon is a citizen with a passport: the lattice periodicity guarantees it a clear direction and a long, ballistic path. In a glass, no periodicity guarantees anything. Long-wavelength vibrations, which average over the disorder, travel well — this is why glass rings and carries sound. But short-wavelength, high-frequency vibrations meet a different fate. Researchers who study amorphous solids have found it useful to split them into three kinds: propagons, which still propagate like waves; diffusons, which diffuse their energy through local coupling without truly traveling; and locons, which are localized and barely move at all. Glasses also show more low-frequency vibrational states than the simplest crystalline theory predicts — the so-called boson peak, still an active research subject, tied to the material's elastic heterogeneity and to enhanced acoustic scattering. The practical upshot is stark: the violent vibrational energy released when a bond snaps cannot cleanly leave. It scatters within nanometers, smeared into heat almost where it was born. This is why glass conducts heat so poorly, and it has a consequence at the crack tip that deserves far more attention than it gets: the tip runs hot and stays hot, vibrationally excited, and the stress-corrosion reaction that ages every screen is a thermally activated barrier crossing. In glass, the messenger loiters at the scene — and the loitering does chemistry.
The disorder also sets fracture's speed limit. A crack is a disturbance that must continuously announce itself to the material ahead; the stress field at its tip is built and rebuilt by elastic waves, so a crack cannot outrun its own announcement. The ceiling is the Rayleigh speed — fitting, since the crack is itself creating new free surface. But long before that ceiling, the channel saturates: energy arrives at the tip faster than a single clean front can shed it, the front goes unstable, and the crack begins to roughen and branch. In silicate glass the terminal velocity lands near thirty to sixty percent of the Rayleigh speed, and the fracture surface keeps the minutes of the whole negotiation. The smooth mirror zone is where the channel still had headroom; the mist is the onset of congestion; the coarse hackle is the channel overwhelmed, the message fragmenting into every available sideband. To read mirror, mist, and hackle is to read a communication log — the record of how a material tried, and finally failed, to carry a message its structure could not hold.
And glass never receives a poke as a blank slate. It carries the memory of its melting, forming, cutting, handling, ion exchange, and every prior load. Chemically strengthened glass makes this vivid: a locked-in skin of surface compression, balanced by tension deep inside, so that an incoming stress wave superimposes on a pre-existing field and the same blow is amplified or blunted depending on its direction, timing, and the depth of the flaw it happens to find. The poke meets a history, not a material.
Plastics: A Message Filtered Through Molecular Time
Polymers carry the liquid's rate-dependence into permanent solidity. A plastic is a tangle of long chains — stiff along each covalent backbone, weakly coupled between chains, with segments that can rotate, straighten, slide, and disentangle on timescales running from microseconds to years. Poke it slowly and the chains have time to slither and rearrange; much of the message is absorbed, dissipated as internal friction, and only weakly transmitted. Poke it fast — faster than the segments can respond — and the tangle has no time to be clever: it answers stiffly, even glassily, and passes the pulse nearly intact. This is viscoelasticity, and it means a plastic responds not only to how hard it is poked but to how quickly, and for how long.
Temperature sets the molecular clock. Near the glass-transition region, a small change in temperature or loading rate can swing stiffness, damping, and wave speed dramatically, because cold slows the segmental motions just as speed outruns them. A plastic is therefore an active filter — a low-pass filter for mechanical news whose cutoff slides with temperature. High-frequency content is attenuated differently from low; a sharp impact pulse spreads in time, its peak falling as its duration grows, its organized energy leaking steadily into molecular motion and finally heat.
This is not a laboratory curiosity. It is the mechanical heart of every bonded display. The adhesive bead holding a cover glass is a communication component. On a warm day under a slow push it whispers, absorbing the message before it reaches the glass. On a cold morning, or in the tenth of a millisecond of a drop, the same bead stiffens into a rigid conductor and delivers the blow verbatim. The identical joint is a different medium at different rates and temperatures — which is exactly why the glass must be understood as living inside a system, not standing alone.
Internal surfaces in plastics
A real plastic is rarely uniform. It holds crystalline lamellae in an amorphous matrix, glass fibers, mineral fillers, rubber domains, pigments, voids, weld and knit lines, molecular orientation, a skin distinct from its core, and — under load — crazes and microcracks. Every boundary is a place where stiffness, density, damping, or adhesion changes, and so a place where a wave reflects, transmits, scatters, or converts mode. Closely spaced boundaries blur the message toward diffusion; poorly bonded fillers open and slide; crazes spin networks of fibrils and voids that concentrate and dissipate energy at once. The same internal surfaces that first absorb and redistribute a poke become, under continued loading, the routes by which damage links and grows. And here the environment enters: a molded skin differs from the core in orientation and residual stress, and moisture, oils, fuels, and cleaners can change molecular mobility or lower the energetic cost of making new surface. In the language of energy-mediated fluid cracking, the fluid does not simply attack the polymer; it alters the energetic and molecular conditions under which existing surfaces extend and new ones form. The mechanical poke, the fluid, the morphology, and the stored stress all speak at once, and failure emerges from their conversation — not from any one voice.
Metals: Communication With Shock Absorbers
A metal crystal is the aristocrat of mechanical communication. Periodic order gives phonons long ballistic paths, and a sea of free electrons adds a second, faster courier for energy — which is why a metal feels cold to the touch and glass does not: the metal conducts your hand's heat away efficiently, the glass cannot. Struck within its elastic limit, a metal transmits with crystalline fidelity through longitudinal and shear modes set by its stiffness and density.
But a real engineering metal is a crystal full of imperfections — grains of differing orientation, grain boundaries, dislocations, vacancies, solutes, precipitates, inclusions, twins, pores, residual stresses — and each one edits the passing message. Grain boundaries partially reflect and scatter waves and convert their mode; fine-grained metal, with more boundary area, scatters short wavelengths more, which is exactly what ultrasonic inspection exploits to read microstructure. Dislocations carry their own strain fields, absorbing energy, moving, or pinning against solutes.
And then the capability no glass possesses: when the message grows too loud, a metal can reroute it into motion. Dislocations glide, letting planes of atoms slip past one another, so that at a stress concentration — where glass has no option but to pour all the arriving energy into a crack tip — a metal spends that energy moving dislocations instead. The sharp tip blunts, the stress redistributes, the message is absorbed into permanent shape change rather than new surface. That single difference is worth two to three orders of magnitude in fracture toughness: on the order of 0.7 to 0.85 MPa·√m for cover glass against 25 to 35 for aluminum alloys and beyond 100 for tough steels. If a metal is overloaded to failure it still, in the end, makes surfaces — voids nucleating at inclusions, growing, linking, necking to final separation — but it argues the whole way down, dissipating energy through plastic work before it concedes. Glass is brittle not because its bonds are weak but because it is monolingual: it has only one language for stress, and that language ends in a crack. Ductility is not the opposite of strength. It is the possession of a second language.
Every Surface Changes the Rules
Everything so far quietly assumed a continuous medium. Real matter is full of interruptions, and every interruption is a place where the conditions governing the disturbance change — an impedance boundary, where the product of density and wave speed shifts, so that an arriving wave must split into reflected and transmitted parts, often converting between longitudinal and shear modes as it does. The outcomes make up a small grammar worth naming plainly.
A wave meeting a boundary may reflect and transmit, the balance set by the impedance mismatch, the angle, the bonding, and the frequency — which is why an air gap isolates vibration, why an adhesive layer can reshape an impact pulse, and why an ultrasonic probe needs couplant. It may refract, bending as its speed changes across the interface. It may convert mode, a longitudinal wave striking a surface at an angle breeding a shear wave, or a body wave at a free surface breeding a Rayleigh wave — the message changing language at the border. It may scatter, a rough or finely structured interface smearing a coherent pulse into a diffuse field. It may disperse, different frequencies traveling at different speeds in plates and layered and viscoelastic media, so a compact pulse spreads as it goes. It may attenuate, its coherent energy converted into heat, plastic work, frictional sliding, crack growth, or scattered waves that no longer travel where we are listening — the message not destroyed but redistributed. And it may resonate or focus, boundaries trapping energy into standing waves or curved features concentrating it, so that a notch, a corner, a hole, a thin section, or a crack receives a far stronger local message than the average response of the whole structure would ever predict.
Internal surfaces are the material's memory
A newly made part already carries a history written in surfaces. Grain boundaries record solidification and heat treatment. Polymer orientation records flow and cooling. Residual stress records uneven deformation or temperature. Scratches record handling; weld lines record how two flow fronts met; a crack records an earlier moment when local energy exceeded local resistance. These internal and external surfaces are the material's memory, and when a fresh poke arrives it interacts with that memory. The wave crosses regions already in tension or compression; it meets interfaces bonded, weakly bonded, debonded, or frictionally rubbing; crack faces open, close, grind, or trap fluid; residual stresses add to the traveling stress or cancel it. The response is path-dependent. Two parts of nominally identical material answer the same poke differently because their internal maps of surface and stored energy differ. This — exactly this — is why a datasheet number cannot fully predict a real part. The datasheet describes the medium in general; the poke interrogates this specific component, with its geometry, its flaws, its constraints, its environment, and its history. It is the whole argument for treating a glass component as a phenotype rather than a specification: the datasheet is the genome, but what breaks or survives is the material as expressed in a particular body with a particular past.
External surfaces: guide, invert, and betray
The outer boundary does three consequential things. It guides, because Rayleigh's surface wave hoards energy in a skin about one wavelength deep, and in a thin part the surfaces couple into guided modes, so the surface receives a disproportionate share of every announcement. It reflects with a change of sign, because a compressive pulse reaching a free surface cannot push on the vacuum beyond and must return inverted, as tension — so a blow harmless as compression on one face can arrive at the far face, reflect, and superpose into a tensile spike just beneath the surface it bounced from. Back-face spalling, damage opposite an impact, is a free surface weaponizing a message that was benign on arrival, and some fraction of the mysterious fracture origins far from any visible impact are this mechanism in disguise. And it betrays, because the external surface is simultaneously the guided channel and the flaw archive: surfaces collect handling damage, and edges — where two surfaces meet, and where cutting left shark teeth and hackle and V-chips — collect the worst damage of all, in a wedge of material with the least surrounding bulk to share the load. Wave mechanics routes the loudest, most persistent part of every disturbance straight through the one region where the largest stress concentrators already wait. The strongest message meets the weakest listener. That coincidence — not bad luck — is why most field failures are born at edges, and why edge quality buys more reliability per unit effort than any other single variable in the process.
Turning the Tables: Engineering the Conversation
If a disturbance is a message shaped by structure, then structure can be designed to shape the message on purpose. This is the leap from studying wave propagation to engineering it, and it has a name: phononic crystals.
A phononic crystal is a material made periodic on purpose — a repeating arrangement of contrasting stiffness or density, in layered stacks, arrays of pillars, or three-dimensional lattices — built so that its internal interfaces interfere with waves in a controlled way. Just as a crystal's atomic periodicity opens electronic band gaps, and a photonic crystal's periodicity opens optical ones, a phononic crystal opens phononic band gaps: ranges of frequency in which mechanical waves simply cannot propagate. Inside a gap, a wave becomes evanescent and dies away exponentially. The medium becomes, for those frequencies, deaf.
The gaps open by two mechanisms, and the distinction matters. Bragg scattering arises when the wavelength is comparable to the spacing of the structure, so that reflections from successive layers interfere destructively — a gap tied to the geometry's scale. Local resonance arises when small built-in resonators, coated inclusions or pillars or membranes, couple to passing waves and forbid propagation in a narrow band regardless of the lattice spacing — which means such gaps can sit at wavelengths far larger than the structure itself, opening the door to controlling low-frequency vibration with a compact part. The same idea, pushed further, yields topological phononic crystals, whose engineered symmetries create edge channels that route waves around sharp corners and past defects without backscattering — robust waveguides for sound and vibration, immune to the imperfections that plague ordinary ones.
The point, for a working engineer, is direct. Everything the earlier sections described as something that happens to a material — reflection, scattering, band-limited transmission, the trapping and channeling of energy — can instead be something a material is built to do. A phononic slab or coating can reflect or absorb the elastic waves from an impact in chosen bands, protecting what sits behind it; a laminated windshield's polymer interlayer and a rugged handheld's foam gasket are early, blunt instances of the same instinct, deliberate internal surfaces placed in the wave's path to edit the message before it reaches the glass. Vibration isolation, seismic barriers, ultrasonic filters, acoustic lenses and cloaks, on-chip control of phonons for quantum devices, even the tailoring of heat flow by filtering the phonons that carry it — all are the same move: arranging structure so that the conversation goes the way you want. We began by learning to listen to what a material says when poked. Phononic crystals are where we start deciding what it is allowed to say.
What the System Heard
Come back, now, to the bench. A force transducer tells us what we applied. An accelerometer tells us what moved. A strain gauge tells us what deformed. A microphone or an acoustic-emission sensor tells us what waves escaped. A thermal camera shows where organized energy became heat. A crack shows where the local conversation went unstable. Not one of these is the whole truth. Each is a single listener at a single place, tuned to a single part of the message.
The poke may begin as a simple exchange of momentum, but the answer divides among translation, rotation, vibration, stored elastic strain, viscoelastic loss, heat, plastic work, the making of new surface, and outright fracture. All roads lead back to energy — but energy travels by many roads, and a measurement that watches only one of them reports only one province of a continental event. This is the deepest reason the datasheet is not the part, and the peak force is not the story.
The holistic questions are not only how hard and how fast. They are: which frequencies were introduced, and how quickly did the load rise? Which wave modes were born, and where did they travel? Which boundaries reflected them, which interfaces absorbed or redirected them? Where was energy stored, where dissipated, where concentrated? And did the disturbance merely pass through — or did it change the material's internal surfaces, and so change how the next poke will be heard?
The Material Is the Conversation
Run the whole progression back. A gas relays a poke by collision — slowly, in one channel, forgetting as it goes. A liquid relays by contact — faster, forgetting shear unless asked quickly, and capable, at a torn surface, of turning a smooth wave into a focused attack. A solid installs permanent wiring and invents the phonon: the crystal transmits with fidelity and, if metallic, keeps shock absorbers on staff; the polymer edits its answers by rate and temperature; the glass transmits fast but scatters the fine detail, hoards energy at hot spots, and, owning no second language for stress, must finally answer overload with a crack — at a speed capped by its own surface-wave courier and recorded forever in mirror, mist, and hackle. And through all of it the surfaces, inside and out, are never mere scenery. They are the routers and mirrors and memory of the network, shadowing and scattering and concentrating and guiding and inverting the traffic — and, once we understand them well enough, the very things we arrange on purpose to command it.
Which returns us, one last time, to why we poke at all. We are dissipative structures, built and driven by a flow of energy we can measure exactly and cannot truly name, and it is in our nature to probe the gradients around us because probing is how such structures find and manage their world. When we poke a material, one energy-processing system questions another, and the material's whole response — elastic and plastic, acoustic and thermal, reversible and final — is that second system managing an energy flow on its own terms, according to its own structure and its own history. Stiffness, sound, heat, damping, and fracture are not five separate properties. They are five dialects of the single thing the conversation is always about.
A material is not a silent, uniform object waiting to be loaded. It is an interconnected energetic system, already carrying the story of its making and its use, answering every disturbance with the whole of that story at once. Neighbors speak to neighbors; structures speak to surfaces; waves speak to defects; the present load speaks to the material's past. What we call material behavior is the sum of that conversation — and if all roads lead back to energy, then to listen carefully to a single poke is to catch, for a moment, the one theme that runs through everything, connecting the crowded room to the crack tip, the candle flame to the curious hand. Every failure has a story to tell. Our work is only to learn how to listen.
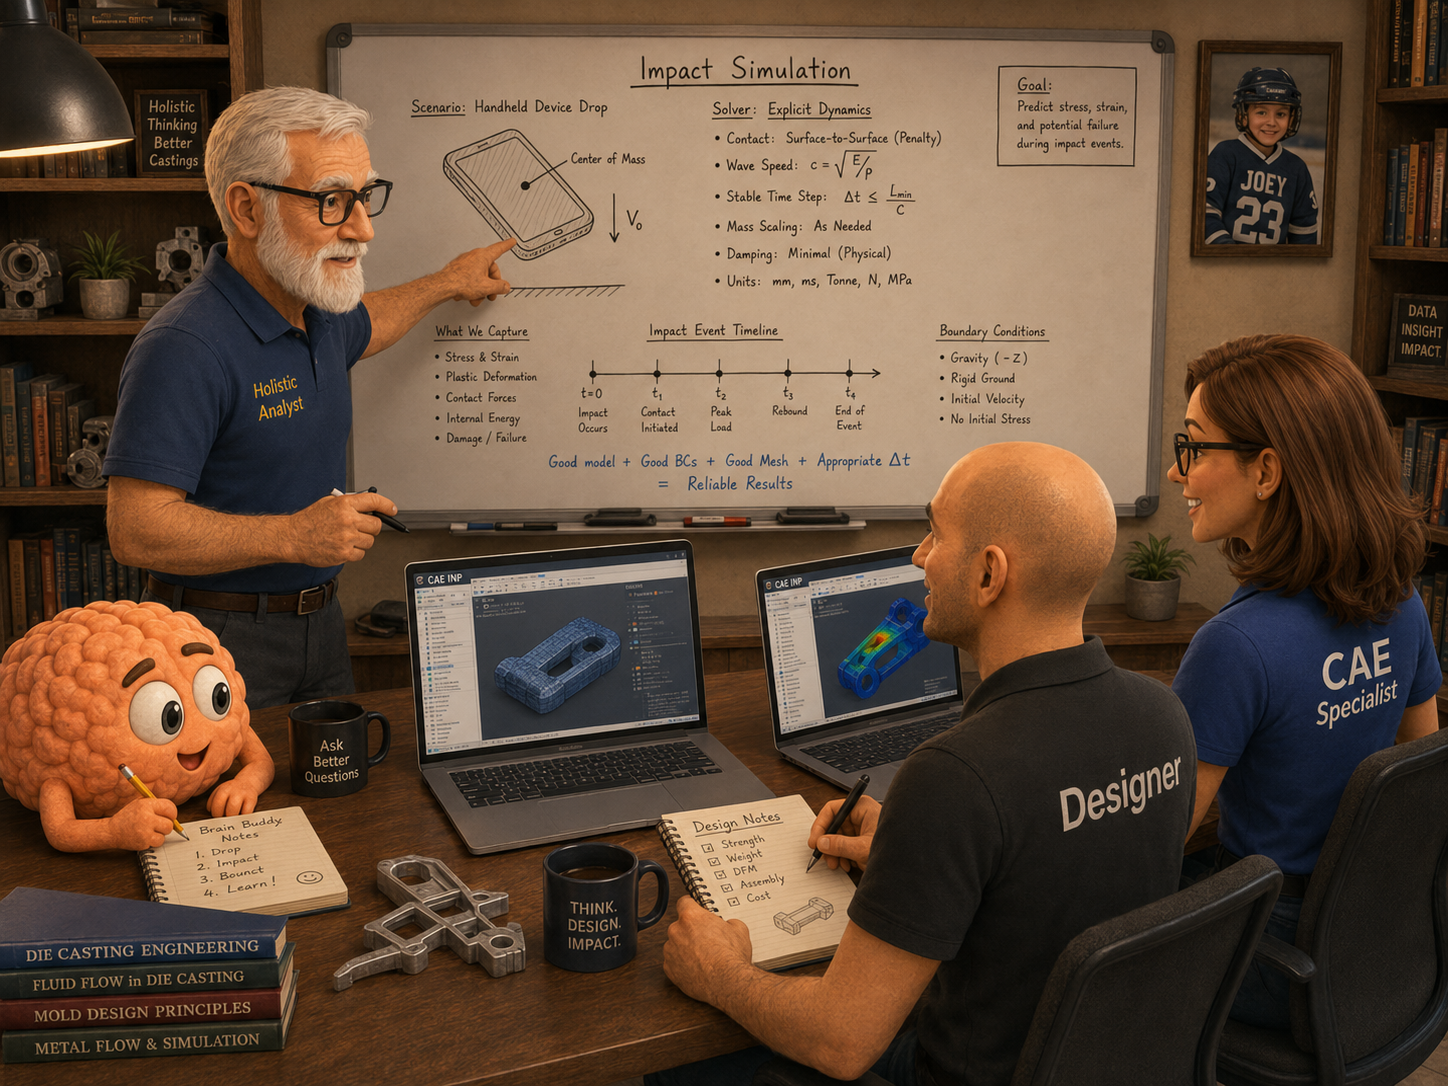
MATERIALS IN FINITE ELEMENT ANALYSIS
Link for audiobook → https://www.dropbox.com/scl/fi/4569p1gutlj3yr27wvvqw/Materials_in_FEA_-_Part_2_Technical_Modeling_Guide.mp3?rlkey=zxf5o23shfs0eq1jkkiouzphj&st=m95bqsaf&dl=0
MATERIALS IN FINITE ELEMENT ANALYSIS
Part Two
The Technical Modeling Guide
Using the Abacus INP Comprehensive Analyzer and other FEA tools
Developed in collaboration with Claude (Anthropic)
BEFORE WE BEGIN.
This is Part Two — the technical guide. It covers how to define materials correctly in Abacus and in any finite element tool. What properties are required and why. The most consequential errors analysts make — wrong units, missing rate dependency, static data in impact models — and how the Abacus INP Analyzer catches them before the solver does.
This guide stands on its own. If you have a drop test model to review and a deadline tomorrow, everything you need is here. But if you have not yet read Part One — the nature of materials, the character behind the numbers — I would encourage you to go there when you can. Part One is tool-agnostic. It covers what materials actually are, not just how to enter them into a solver. When you return to this guide after Part One, the density requirement will mean something different. The rate-dependent plasticity flag will mean something different. The three questions at the heart of this guide will mean something different. The technical content does not change. Your relationship to it does.
THE MATERIAL CARD IS NOT THE MATERIAL.
In drop and impact analysis, materials are where simulations fail silently. A perfect mesh with perfect contact can still give you completely wrong results if the material model is wrong. And many of these errors look plausible right up until the physical test.
Here is what that looks like. A design team runs a drop test simulation on a polymer housing. Clean model, solid mesh, correct boundary conditions, properly defined contact, material card from the supplier datasheet. The simulation shows a safety factor of two-point-five. Physical drop testing: the part fractures on the first drop. Cleanly. At the screw boss. The analyst did not know where the injection mould weld line was. The actual strength at that location was forty percent of the datasheet value. No amount of mesh refinement recovers from that.
Three questions to run through before accepting any material card. Where did this property come from? What process created the part? And what environment will the material see? If you cannot answer all three with confidence, document your assumptions explicitly before submission. A simulation with clearly documented material assumptions is honest engineering. A simulation with unchecked defaults is mind blindness.
THE FOUNDATION. DENSITY, ELASTICITY, AND UNITS.
In explicit structural dynamics, deformable materials require at minimum two things: density and a stiffness definition. Without density there is no mass, no inertia, no gravity effects, and the explicit solver cannot compute dynamics. Without elastic properties, the solver cannot compute wave speed, which governs the stable timestep. Static analyses, thermal models, and rigid body definitions have different requirements — these rules apply specifically to deformable components in dynamic impact models.
The unit system trap on density is the most destructive single error in production drop models. In the tonne-millimetre-second system, steel density is 7.85 times 10 to the negative 9 tonnes per cubic millimetre. Not 7850. Not 7.85. Put the SI value in a tonne-millimetre-second model and you have declared steel a trillion times denser than it is. The dangerous version is a mixed model — some materials entered in SI, some in tonne-millimetre-second — where the errors partially compensate and the results are wrong but not obviously so. The unit system detector in the Analyzer cross-references every material's modulus and density against a library of known engineering materials in both unit systems. Use it on every model.
Poisson's ratio: keep it in the range 0.15 to 0.45 for most structural materials. Values of 0.49 or even 0.499 are physically valid for near-incompressible materials and are acceptable when used with appropriate hybrid element formulations. Only exactly 0.5 produces a mathematically singular bulk modulus and must never be used. For elastomers and foam, use hyperelastic formulations rather than elastic with Poisson's ratio approaching 0.5 — not as a workaround, but because hyperelastic theory is the physically correct constitutive framework for those materials.
METALS. PLASTICITY DATA AND THE MONOTONIC REQUIREMENT.
The property on the mill certificate and the property in your finished part are often not the same number. Alloy temper is the single most important designator. Aluminium 6061: O-temper yield stress approximately 55 megapascals, T4 approximately 145, T6 approximately 276. A five-to-one range from the same alloy depending entirely on heat treatment. Die-cast metals carry porosity — ADC-12 die-cast aluminium yield stress approximately 145 megapascals, not 6061-T6 wrought. Welded aluminium carries a heat-affected zone with a five-times local yield reduction invisible in a model with uniform T6 properties.
Plasticity data must be in true stress and true plastic strain — not the engineering stress-strain curve from the datasheet. True stress equals engineering stress times one plus engineering strain. True total strain equals the natural log of one plus engineering strain. True plastic strain is then true total strain minus the elastic component — for small elastic strains, that is true stress divided by Young's modulus. These conversions are valid up to necking. Beyond necking the simple formula breaks down, and the true stress and strain at the neck must be measured or inferred.
The monotonic condition: the plasticity framework in every major FEA solver assumes the tangent modulus of the true stress-true strain curve remains positive throughout the plastic region — the material hardens as it deforms, spreading deformation rather than concentrating it. For structural metals, the true stress-strain curve is genuinely monotonically increasing even through necking. The engineering curve descends after the ultimate tensile strength because you are dividing by the original area rather than the shrinking current area. The material at the neck is still hardening — the geometry is softening, but the material is not. Entering the engineering curve directly gives a descending post-ultimate branch that violates the monotonic condition. For polymers with a pronounced upper yield drop — nylon, polypropylene, polyethylene — the true stress-strain curve genuinely descends from upper yield to lower yield plateau. Regularise the data: replace the descending branch with a horizontal step directly from upper yield point to lower yield plateau. Apply this regularisation independently at each strain rate in your rate-dependent tables. Check the maximum plastic strain in your results against the maximum strain in your input data. If elements are operating beyond your data range, the extrapolated response is an assumption. Document it.
Rate-dependent plasticity: local strain rates in drop test contact zones reach 10 to 1000 per second. Many structural metals show yield strength increases at impact rates — 20 to 50 percent is common for some grades, but the actual magnitude must come from material-specific data or calibrated rate constants. Using only quasi-static data underpredicts peak contact forces and overpredicts deformation. The Analyzer flags every plasticity material in an explicit dynamic model that lacks a rate-dependent definition.
Johnson-Cook combines strain hardening, rate strengthening, and thermal softening in one expression. Three multiplicative terms: A plus B times equivalent plastic strain to the power n — strain hardening. Times one plus C times the log of the normalised strain rate — rate strengthening. Times one minus homologous temperature to the power m — thermal softening. Representative parameters for common structural steels: A 350 to 550, B 400 to 800 megapascals, n 0.2 to 0.4, C 0.01 to 0.04, m 0.5 to 1.0. For 6061-T6 aluminium: A 270 to 324, B 150 to 500, n 0.3 to 0.45, C 0.002 to 0.015, m 0.8 to 1.34. Do not pair Johnson-Cook with a separate rate-dependent definition — the rate term is already inside Johnson-Cook. The Analyzer flags this double-counting.
PLASTICS. THE STATIC MODULUS COMPROMISE AND WHAT IT MEANS.
Plastics are rate-dependent, temperature-dependent, moisture-dependent, viscoelastic, anisotropic after moulding, and history-dependent. Steel shares some of these characteristics — it is rate-dependent and temperature-dependent, and it carries its manufacturing history — and we have covered those effects in depth. But in plastics these effects are fundamentally different in both magnitude and nature. Steel does not absorb moisture in ways that halve its modulus. Steel is not normally modelled as viscoelastic at room-temperature structural engineering conditions. And while steel’s rate sensitivity raises yield strength by 20 to 50 percent at impact rates, it does not switch the failure mode from ductile to brittle the way temperature and rate can in polycarbonate. The combination — moisture, viscoelasticity, moulding-induced anisotropy, weld lines, and large shifts in both strength and failure mode with rate and temperature — is what makes plastics uniquely demanding to model correctly.
Here is something important to understand about how we typically model polymers in drop simulations, and what that approach does and does not capture. The most common approach is a fixed elastic modulus taken from quasi-static test data, combined with rate-dependent plastic stress-strain curves at multiple strain rates. This approach captures the significant increase in yield strength with strain rate — which is the dominant effect — and the change in post-yield behaviour and energy absorption capacity. But it does not capture the rate-dependent stiffness below the yield point. In reality, the initial modulus of most engineering polymers increases noticeably at the high strain rates encountered during drop impacts — the polymer chains have less time to relax, the material feels stiffer even before yielding. That increase in pre-yield stiffness is invisible to a fixed elastic modulus definition. To capture rate-dependent stiffness fully — in both the elastic region and at yield — you need a viscoelastic model using the Prony series, covered in the next section.
For most production drop simulations of handheld devices, the static modulus plus rate-dependent plasticity compromise is acceptable and widely used. The reason: the highest strain rates in a drop event are localised — concentrated in the immediate contact zone, sharp corners, ribs, and screw bosses. The majority of the part experiences much lower strain rates where the fixed elastic modulus is a reasonable approximation. The biggest errors from ignoring rate effects entirely are in the post-yield regime — underpredicted peak forces and overpredicted deformation — and those are captured by the rate-dependent plasticity tables. Use the static modulus plus rate-dependent plasticity as your baseline. Add a Prony series viscoelastic definition when you need better correlation with measured acceleration traces or force-time histories, or when large areas of the part are experiencing moderate-to-high strain rates simultaneously.
The monotonic condition for polymer plasticity is more demanding than for metals. Regularise the upper yield drop for nylon, polypropylene, and polyethylene — replace the descending branch with a horizontal step at the lower yield plateau. Apply this at every strain rate independently. The Analyzer flags engineering polymers — modulus 50 to 5000 megapascals — missing rate-dependent definitions in explicit dynamic steps, with a message tailored specifically to polymers. Thermoplastics are often more rate-sensitive in terms of failure mode change than metals.
For moisture: nylon at 50 percent relative humidity has Young's modulus approximately 1600 megapascals and yield near 55 megapascals — a factor of two lower than dry-as-moulded. Weld lines reduce strength 30 to 70 percent at the weld location. Create separate element sets at weld line locations with reduced failure thresholds. For failure criteria: maximum equivalent plastic strain for ductile behaviour, maximum principal stress for brittle. Check both and use the lower safety margin as governing.
THE PRONY SERIES. CAPTURING RATE-DEPENDENT STIFFNESS.
The Prony series is one of the most common and widely supported ways to represent time-dependent stiffness in FEA — it tells the solver that the stiffness of a material is not fixed, but depends on how fast you load it. This is the heart of viscoelastic behaviour. When you load a polymer slowly, the molecular chains have time to uncoil, slide past each other, and relax. The material feels softer. When you load it very quickly — as in a drop impact — the chains do not have time to relax. The material responds with higher stiffness. The standard fixed elastic modulus plus rate-dependent plasticity approach cannot capture this pre-yield stiffening. The Prony series does.
The Prony series represents the time-dependent relaxation behaviour using a sum of exponential decay terms. Each term has three parameters: a relative shear modulus fraction, a relative bulk modulus fraction, and a relaxation time tau. The relaxation time controls which loading rates that term governs. A short relaxation time — a small tau — activates at high loading rates, corresponding to the fast dynamics of a drop impact. A long relaxation time activates at slow loading rates, corresponding to quasi-static bending or sustained loads. Multiple terms covering a wide range of relaxation times together describe the full viscoelastic character of the material across the entire rate spectrum from creep to impact.
To calibrate Prony series parameters from physical testing, the most direct method is a stress relaxation test: apply a fixed strain to a specimen and record the decaying force over time. Convert force to stress using the specimen geometry, normalise by the initial stress to get the relaxation modulus as a function of time, and fit the Prony terms to that curve. Most FEA solvers — including Abacus — have built-in curve fitting tools that take relaxation test data directly and output the Prony series constants. Recording data at 0.1 second intervals may be adequate for capturing slower relaxation terms, but impact-rate calibration requires sufficiently dense early-time data to resolve the short-time relaxation response. Longer test durations are beneficial, not a limitation — they capture the longer relaxation times that govern quasi-static and creep behaviour and allow the complete relaxation spectrum to be characterised.
A key practical point on test coverage: the early data in a stress relaxation test — the first few seconds — captures the fast relaxation terms that govern impact-rate behaviour. The later data captures the slow terms that govern creep and sustained loading. Know which regime drives your application and make sure your test covers it.
Testing at multiple strain levels is important for polymers because they are often nonlinear viscoelastic — the relaxation behaviour changes with the strain level. Test at the strain levels that represent the actual loading in your simulation, not just at a single convenient amplitude. For chemical exposure effects, applying the chemical to the specimen face that is in tension during the relaxation test is far more discriminating than testing unstressed specimens — the chemical reaches the most vulnerable molecular locations and the effect is detected much sooner. This is particularly valuable for evaluating cleaning fluid compatibility and chemical stress cracking risk.
When implementing Prony series in Abacus, use the Star Viscoelastic, Time equals Prony keyword. Combine it with a Star Elastic definition as the base modulus — the Prony terms are fractional relative to that base. For elastomers and large-strain polymer components, combine with a hyperelastic base instead. The Analyzer flags viscoelastic materials without a Prony series definition as incomplete, and flags adhesive-type materials in explicit dynamic steps that appear to use only static properties.
DISPLAY GLASS, ADHESIVES, ELASTOMERS, AND FOAM.
Glass is linear elastic until fracture. No yield. Failure metric is maximum principal stress — not Von Mises. Young's modulus approximately 70 gigapascals, Poisson's ratio approximately 0.22. Fracture strength varies from 50 megapascals for annealed glass to 700 to 800 megapascals for pristine chemically strengthened cover glass, with a surface scratch potentially reducing that to 150 to 200 megapascals. Calibrate the failure criterion from biaxial flexure tests on production panels in the fielded surface condition — not pristine laboratory specimens. Model residual biaxial compression as an initial condition for tempered and chemically strengthened glass — omitting it can significantly underestimate the effective tensile strength the glass can sustain before the surface goes into net tension.
Pressure-sensitive adhesives like VHB are viscoelastic — significantly stiffer under impact than under static loading. Using static properties overpredicts deflection of bonded components and underpredicts load transmitted through the bond. Both errors are unconservative. Use Star Viscoelastic Time equals Prony with coefficients fitted to dynamic mechanical analysis data at impact-relevant frequencies, combined with a hyperelastic base.
Elastomers require hyperelastic formulations — not Young's modulus. Neo-Hookean for strains to about 50 percent. Mooney-Rivlin to about 150 percent — the most widely used industrial model. Yeoh for carbon-black-filled rubbers. Ogden and Arruda-Boyce for large-strain applications. Constants must be fitted to test data spanning the actual deformation modes — uniaxial alone is insufficient. Use hybrid elements — C3D8H, C3D10H — to prevent volumetric locking.
Foam requires a foam-specific constitutive model — Hyperfoam for recoverable cellular foam, Crushable Foam for permanently crushing foam — not low-stiffness linear elastic. Linear elastic captures only the initial cell-bending regime and misses the energy-absorbing plateau and densification entirely. Fit constants to dynamic compression test data — quasi-static datasheets underestimate foam stiffness during a drop event.
RATE DEPENDENCY, TEMPERATURE, AND WHAT THE ANALYZER CHECKS.
For impact, drop, and crash simulations, any material expected to enter plasticity should be evaluated for strain-rate sensitivity. If rate effects are not modelled, that assumption should be justified and documented — not left as an unchecked default. Many structural steels show significant yield strength increases at impact rates — the magnitude varies with grade, strain-rate range, and temperature, but increases of 20 to 50 percent are common for typical structural grades, and can be higher. Engineering polymers shift failure mode as well as magnitude. Good test correlation using static properties is often accidental — two errors compensating each other — not physically correct modelling. That kind of correlation does not transfer when the design changes.
Temperature: polycarbonate at minus 40 degrees is approximately 55 percent of room-temperature strength with failure mode shifted toward brittle fracture. Nylon with combined temperature and moisture effects can lose a factor of 4 to 6 in stiffness versus dry-as-moulded room-temperature data. If the qualification range includes cold or hot environments, temperature-dependent property tables are required.
The Analyzer Recommendations tab checks: missing density on any material — always flagged as error. Density magnitude inconsistent with detected unit system — cross-checked against material library. Rate-dependent plasticity absent in explicit dynamic steps — flagged for metals and engineering polymers separately. Viscoelastic without Prony series definition — flagged as incomplete. User material UMAT or VUMAT — flagged as cannot-validate. Johnson-Cook with redundant separate rate-dependent definition — double-counting flagged. Damage initiation criteria inconsistent with the material type.
The Materials tab total assembly mass computed from mesh volumes times densities is one of the most powerful quality checks available. Compare it to the physical product weight. A discrepancy greater than 10 percent demands investigation before submission. Missing part, wrong density, unit system error, section assignment problem. Find it before the solver does.
CLOSING.
When materials are right, everything else has a fighting chance of being right too. When they are wrong, no mesh density, no contact formulation, no solver sophistication recovers from it.
When someone asks you in a design review why you believe the simulation correctly predicts drop survival, the strongest answers start with: let me show you the energy balance, and: let me walk you through the material models we used. When you can answer both of those with confidence, the simulation has earned its safety factor.
And if you have not yet read Part One — the nature of materials — it is there waiting. It will not change the keywords. It will change how you hear them.